An overview of the status of your stack
See the status of all dbt checks and Synq monitors in one place.
We hope you’re having a delightful summer.
Here at Synq, we found the time between sunburns and mosquito bites to bring you some refreshing updates.
System status
You can now see an overview of all the issues detected by your dbt tests and Synq monitors in a single screen.
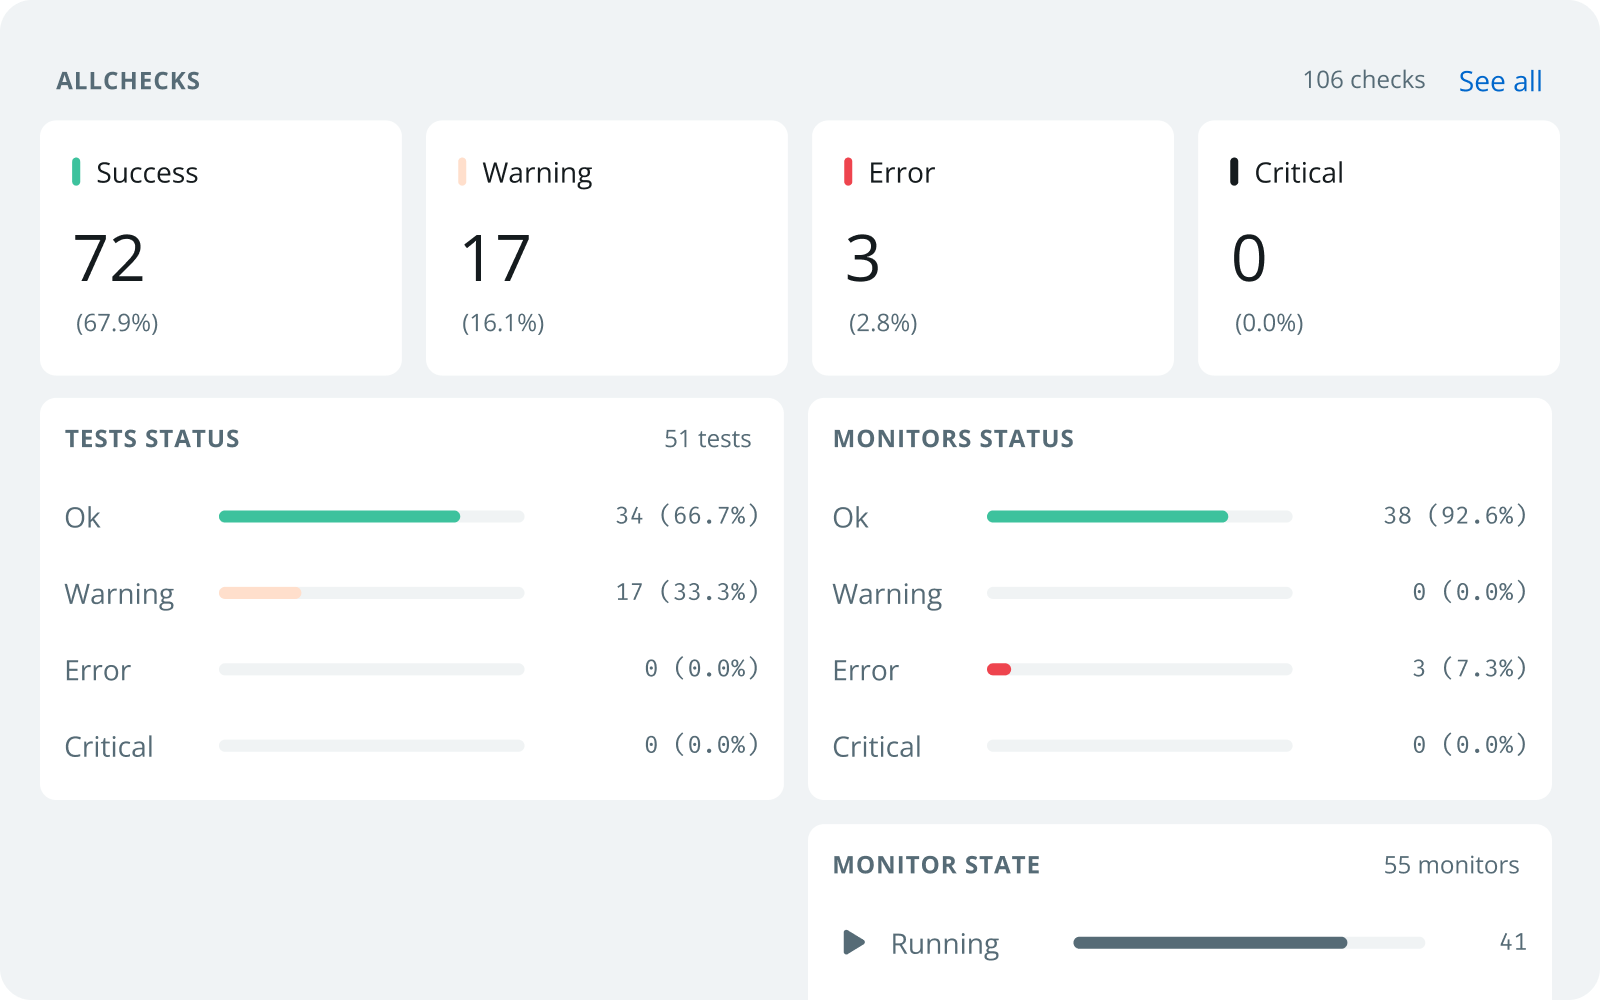
Status tiles: A summary of all your health checks
At the top of the monitors section, four tiles aggregate every issue by status.
You can click on each to get a list of all issues per status.

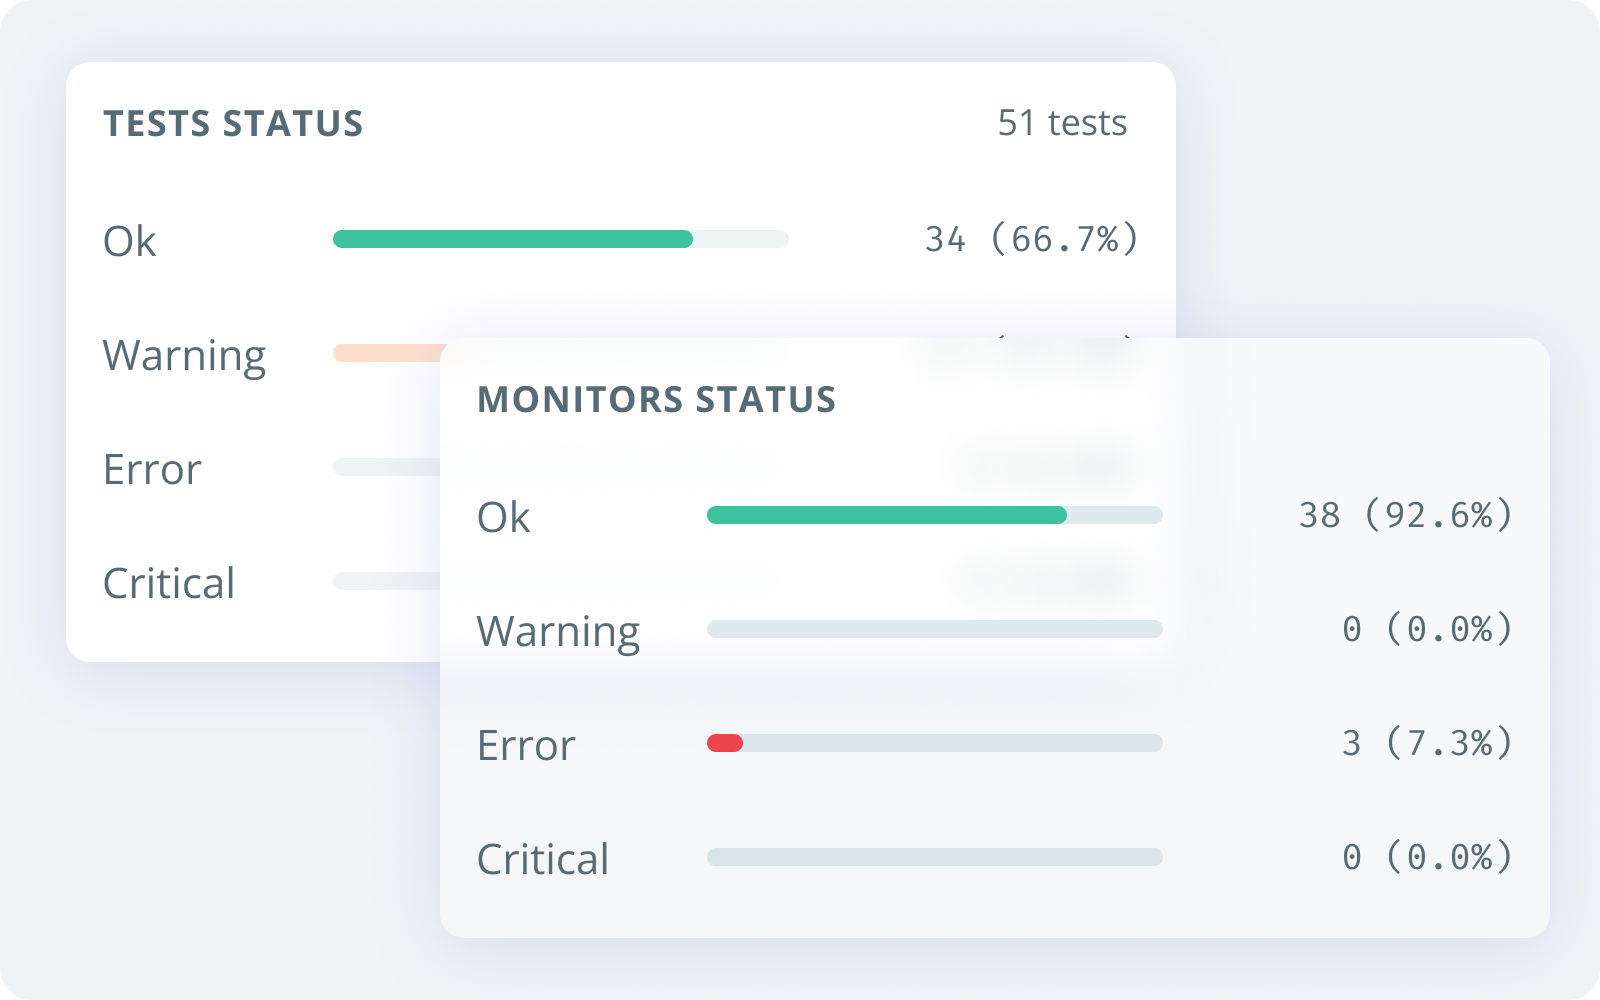
Status per type of check
Right below the status widgets, you can see all errors aggregated by platform. This makes it easy to see if the errors were caught by one your dbt tests or by your Synq monitors.
This gives you a sense of the type of error and should help you narrow down your inspection when triaging and debugging.
You will still see a widget for your dbt tests if you don’t have monitors enabled.
Monitors state
For those of you who have monitors enabled, you will see an additional widget below with a breakdown of the state of each monitor.
You can also quickly create a monitor from here.

Build with data you can depend on
Join the data teams delivering business-critical impact with SYNQ.