SYNQ Changelog
New updates and improvements to SYNQ.
Data Product Monitoring
Recommended monitors, impact filters, improved triage, and new navigation


Improved Lineage
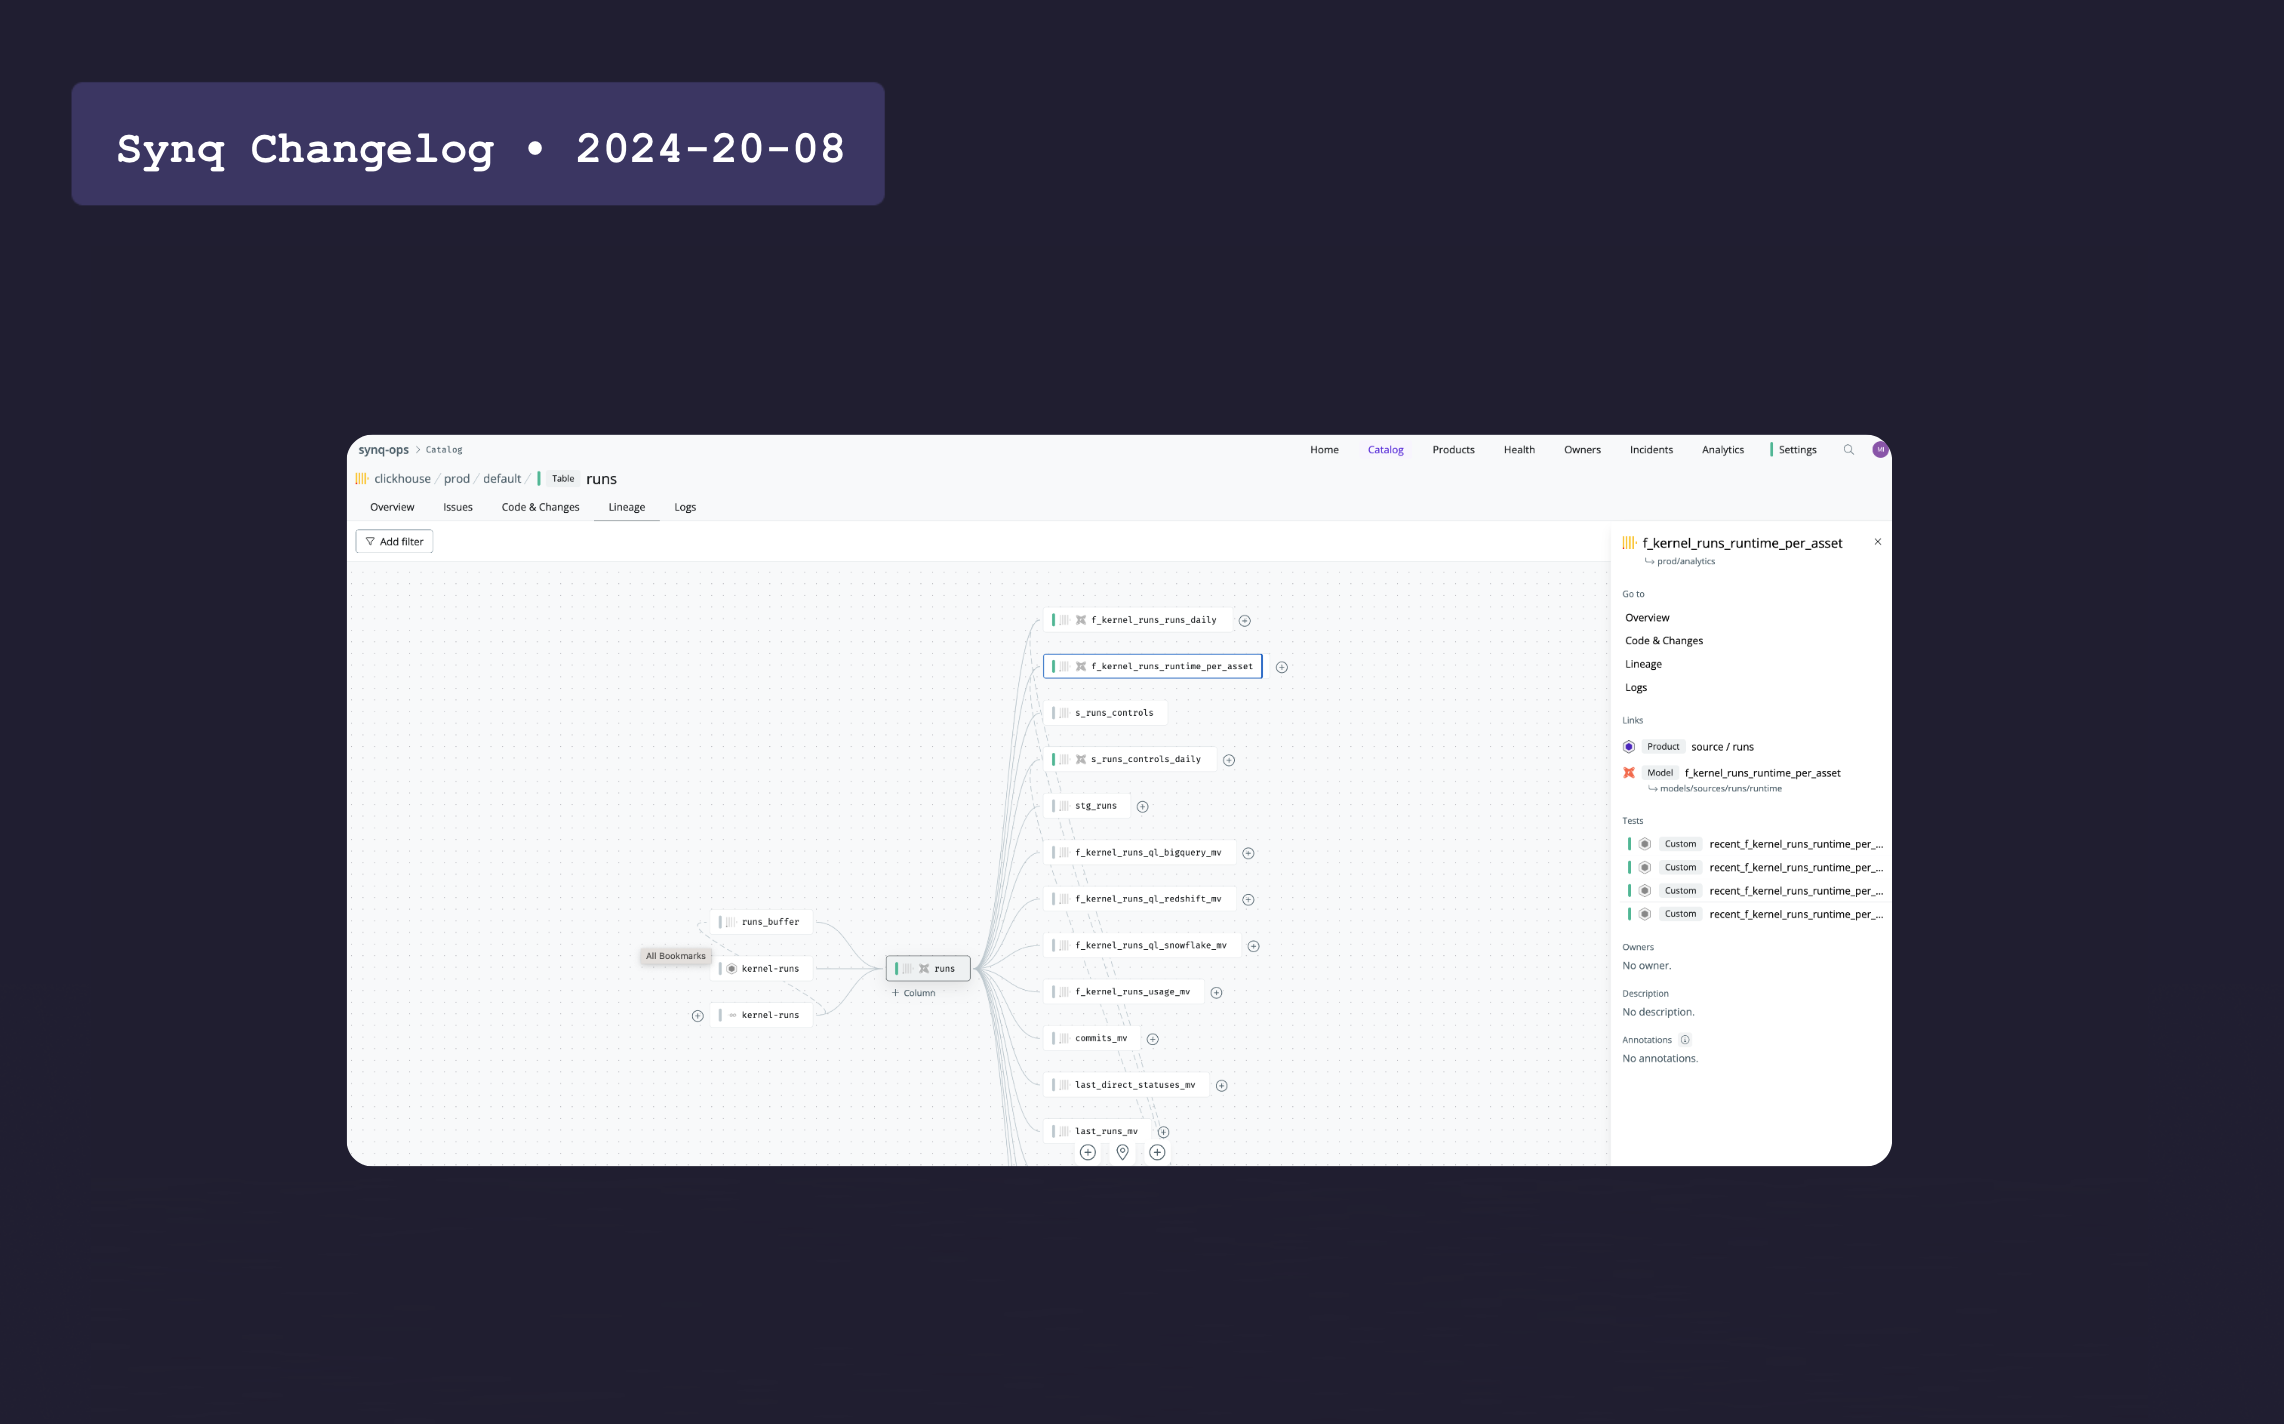
New lineage functionality, updated catalog, and improved statuses
Get alerted in Microsoft Teams
Microsoft Teams integration and public API improvements
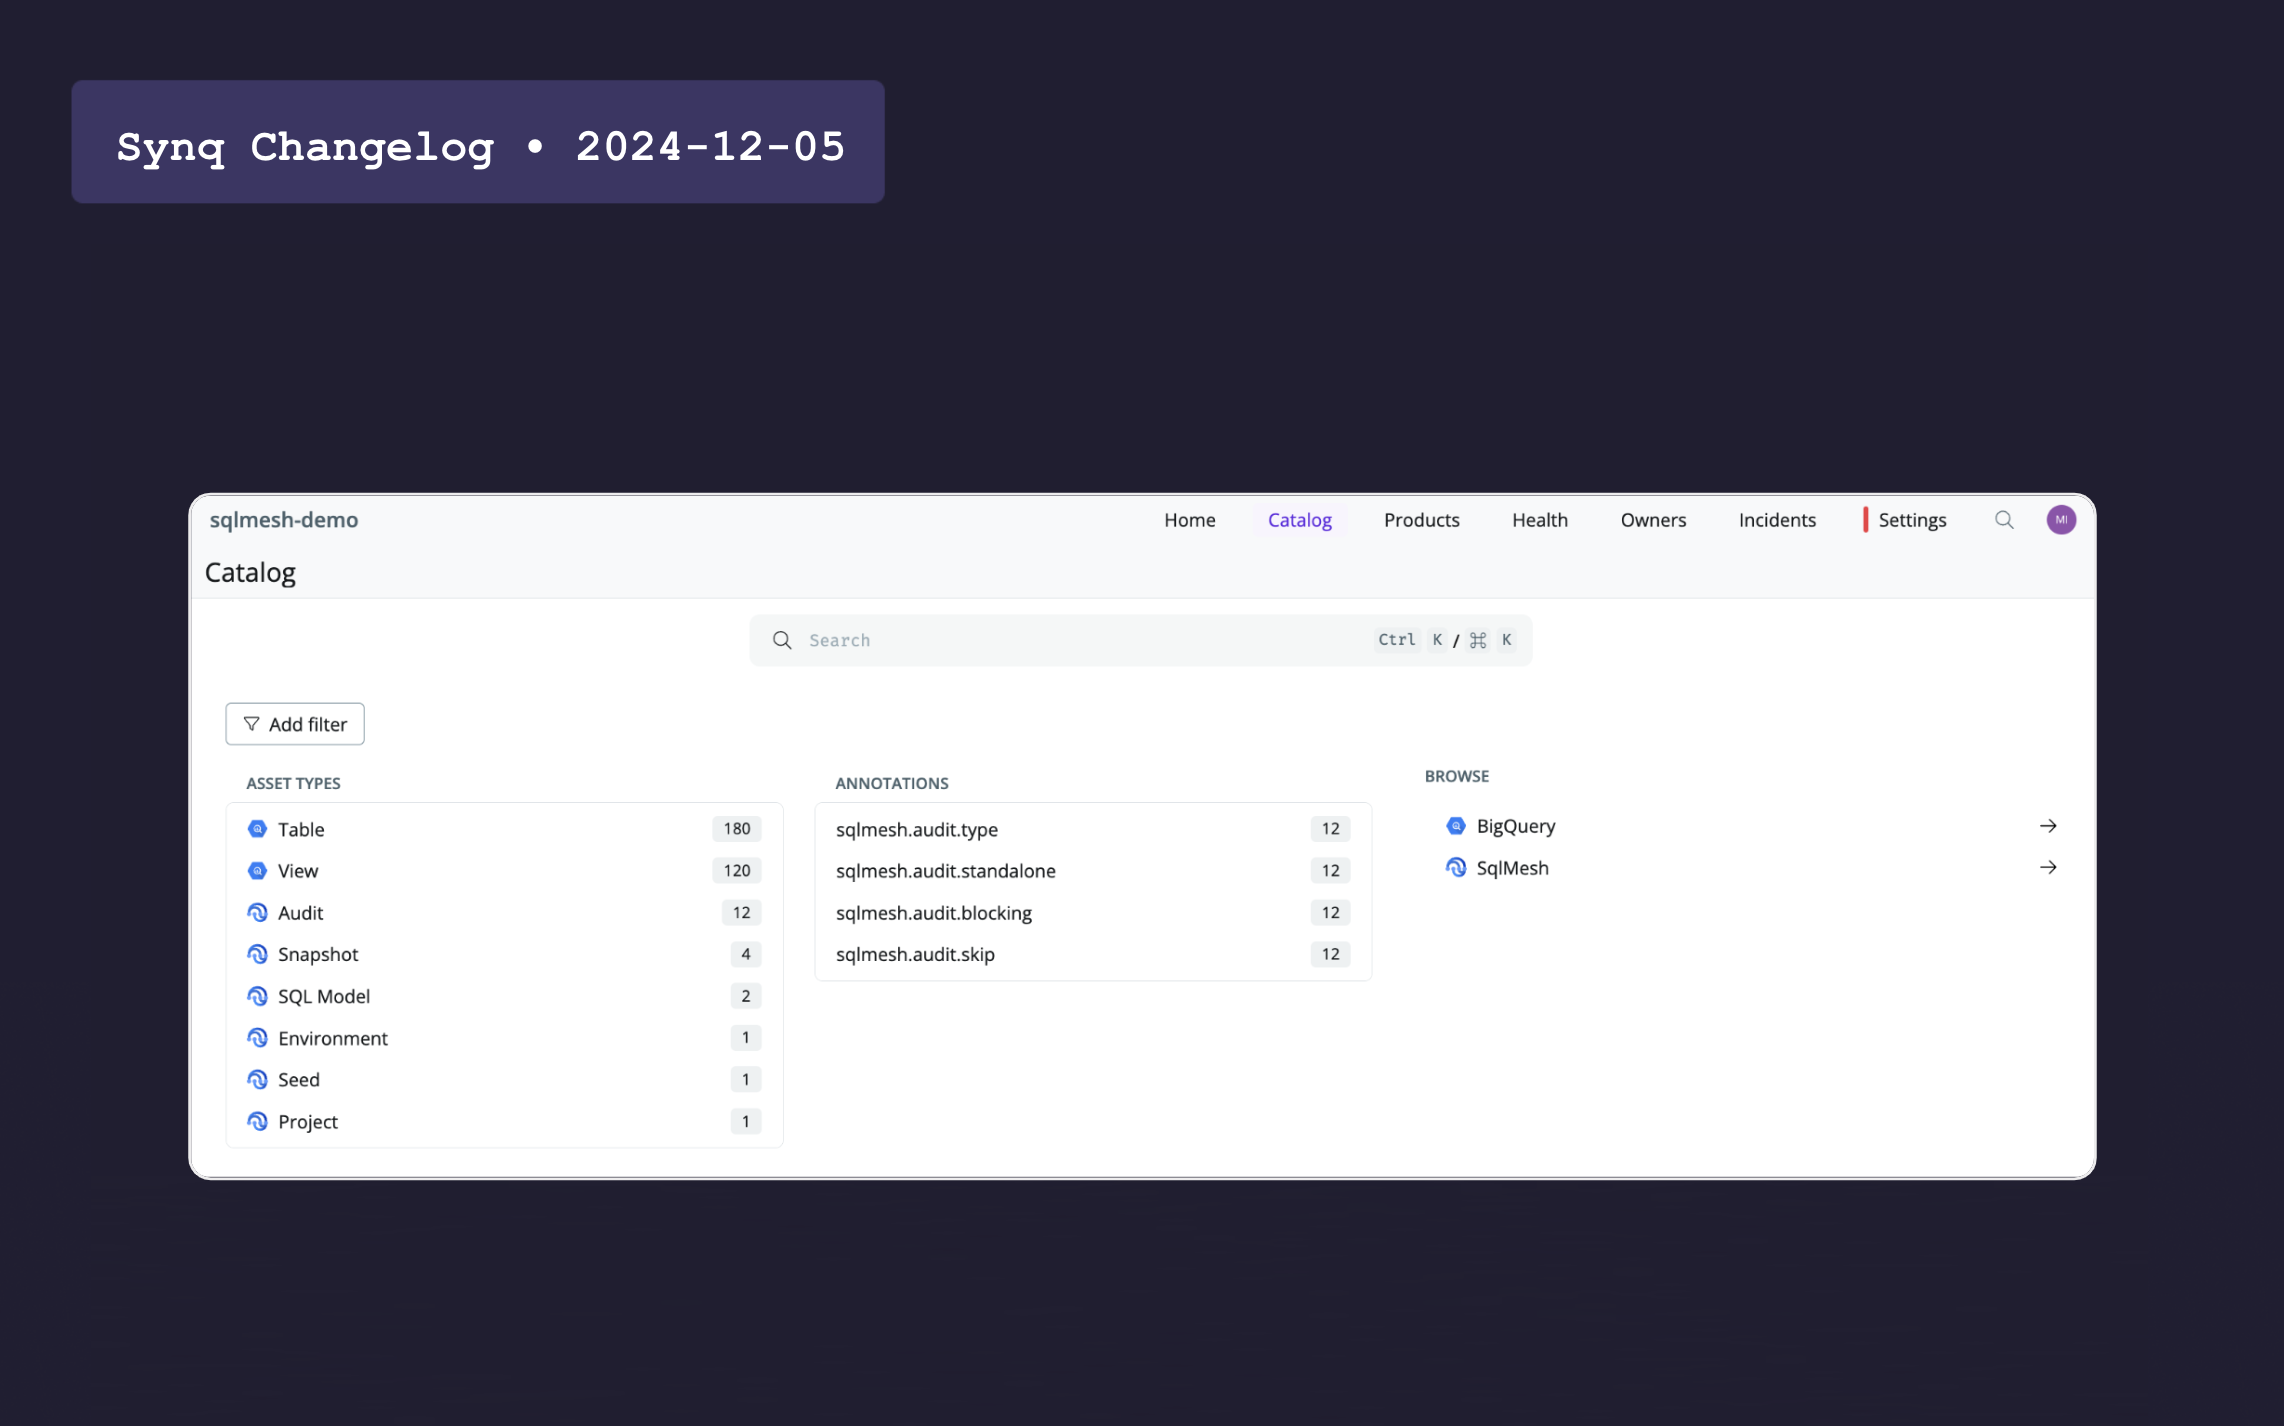
SQLMesh integration and analytics drill-down
SQLMesh integration, analytics drill-down and improved dbt support
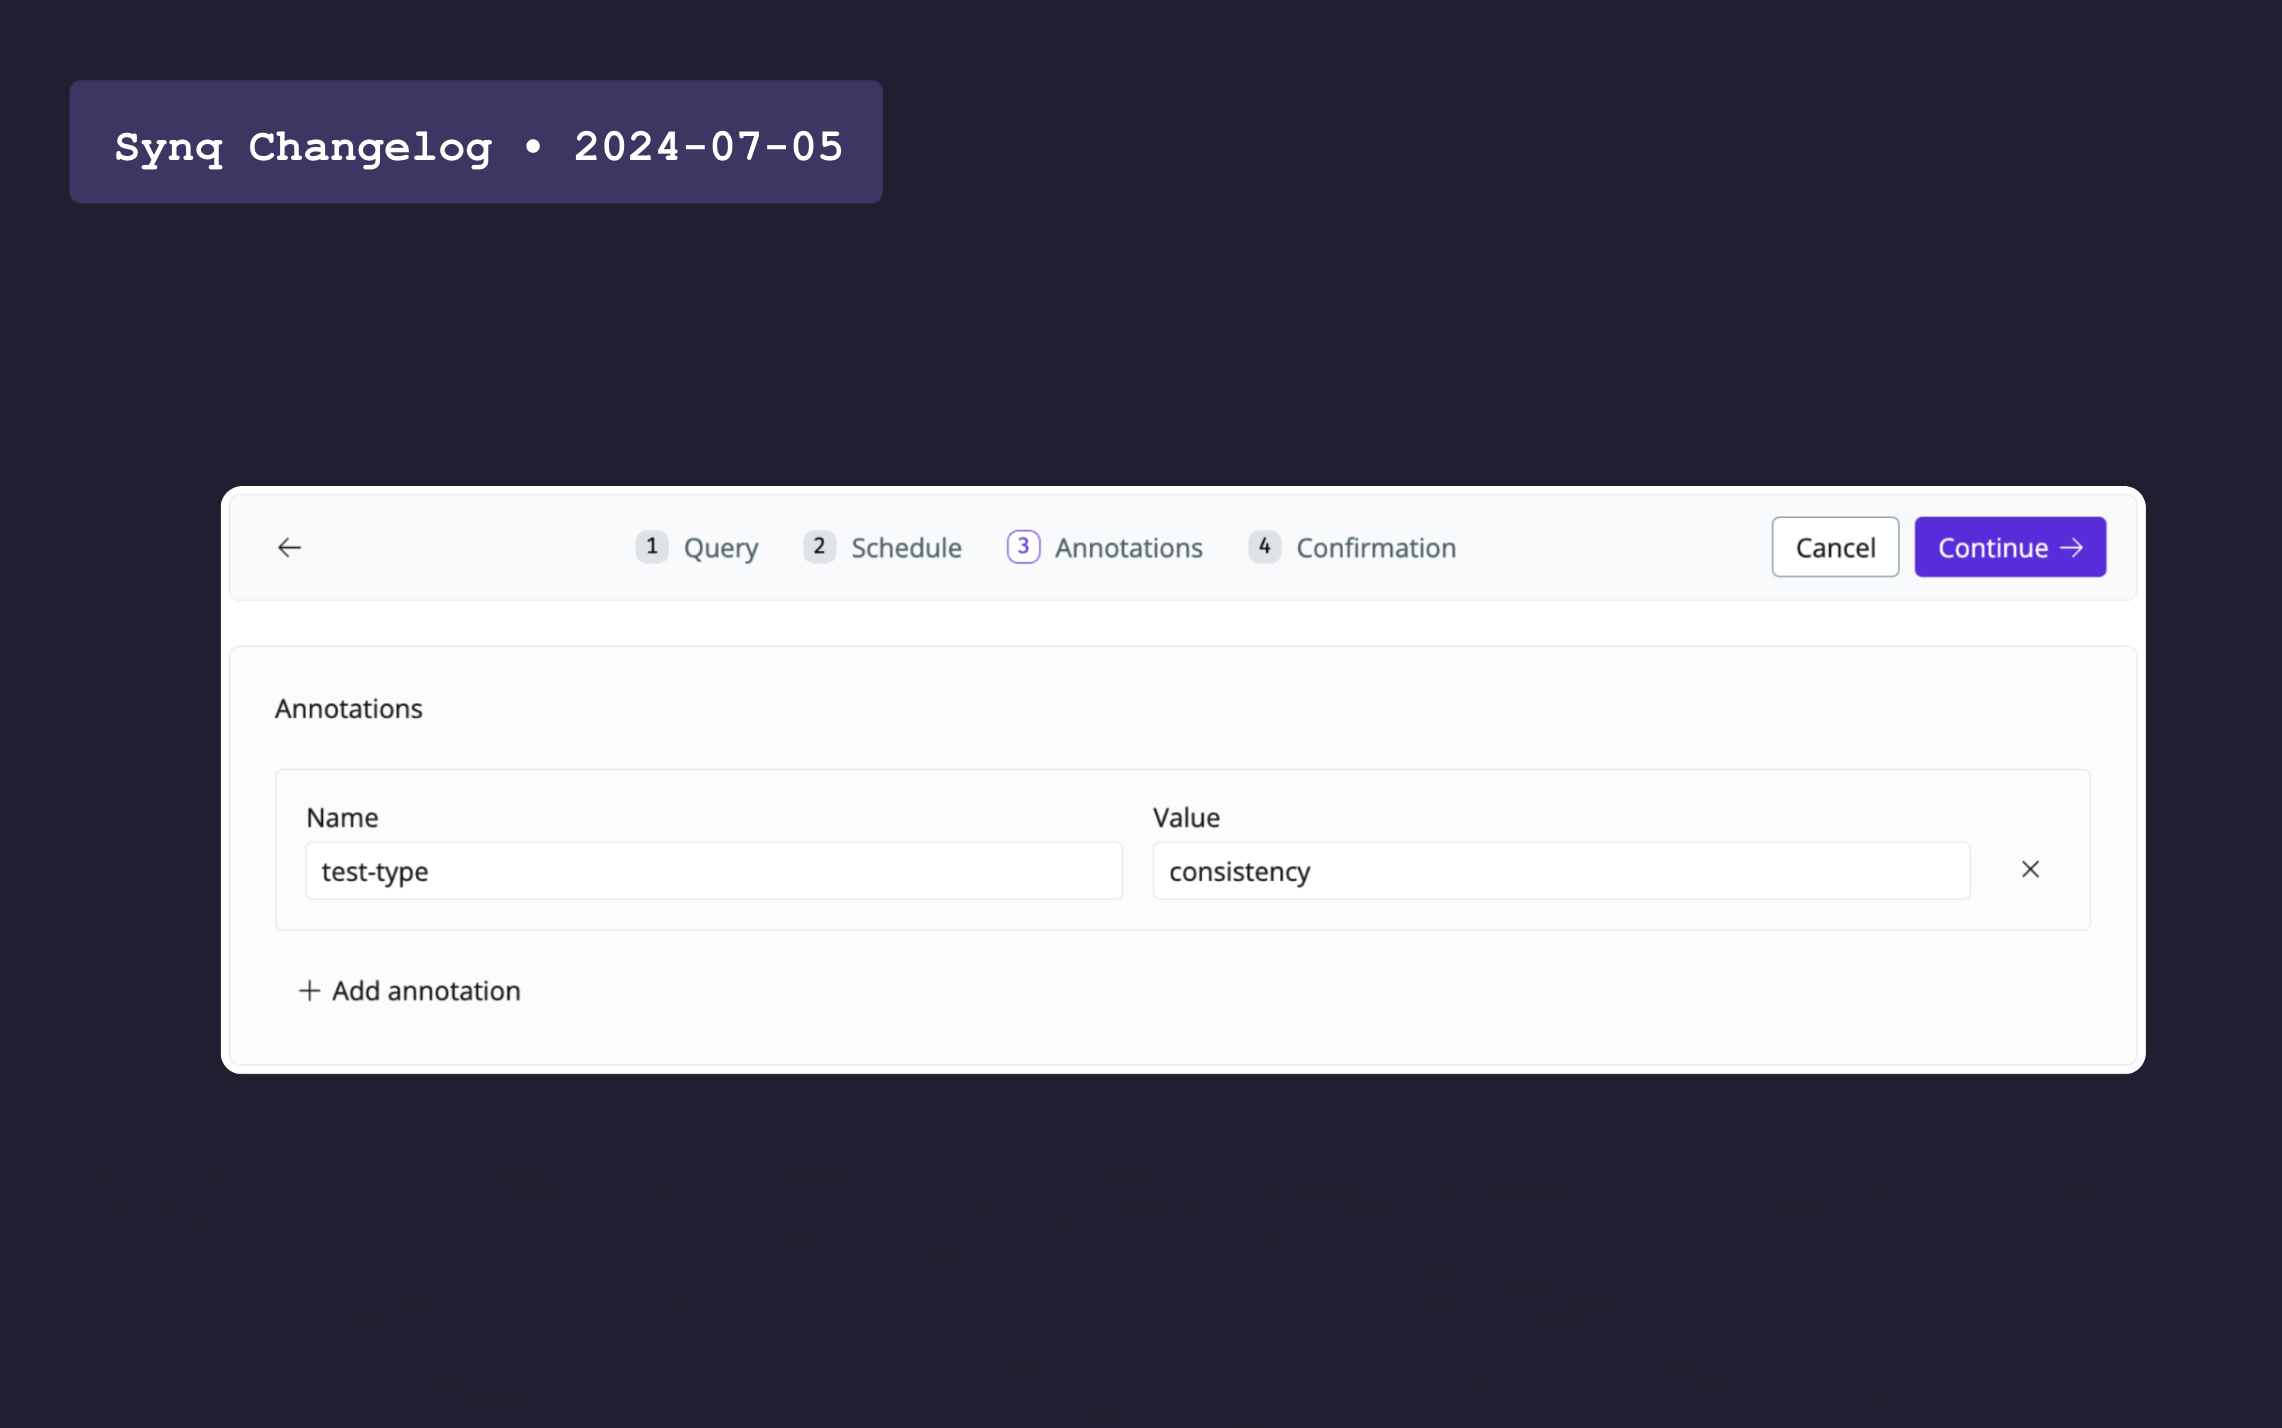
Reducing alert overload
Ongoing alerts, annotations for SQL tests, and improved search & navigation
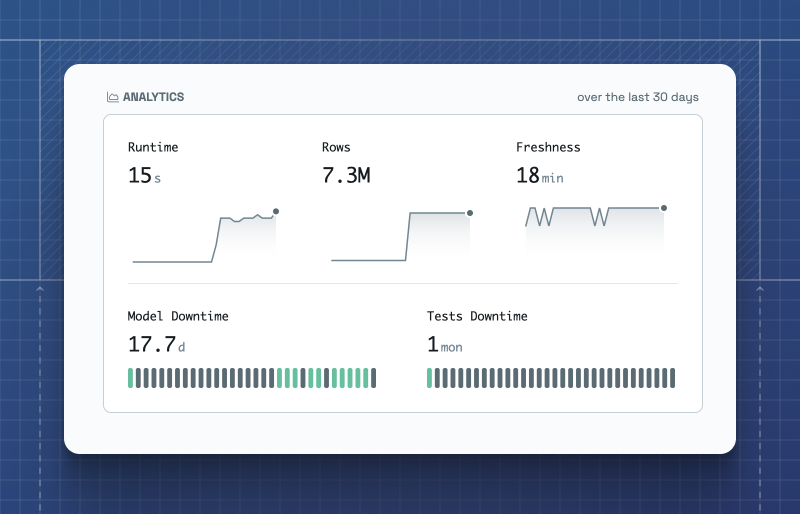
Synq Analytics
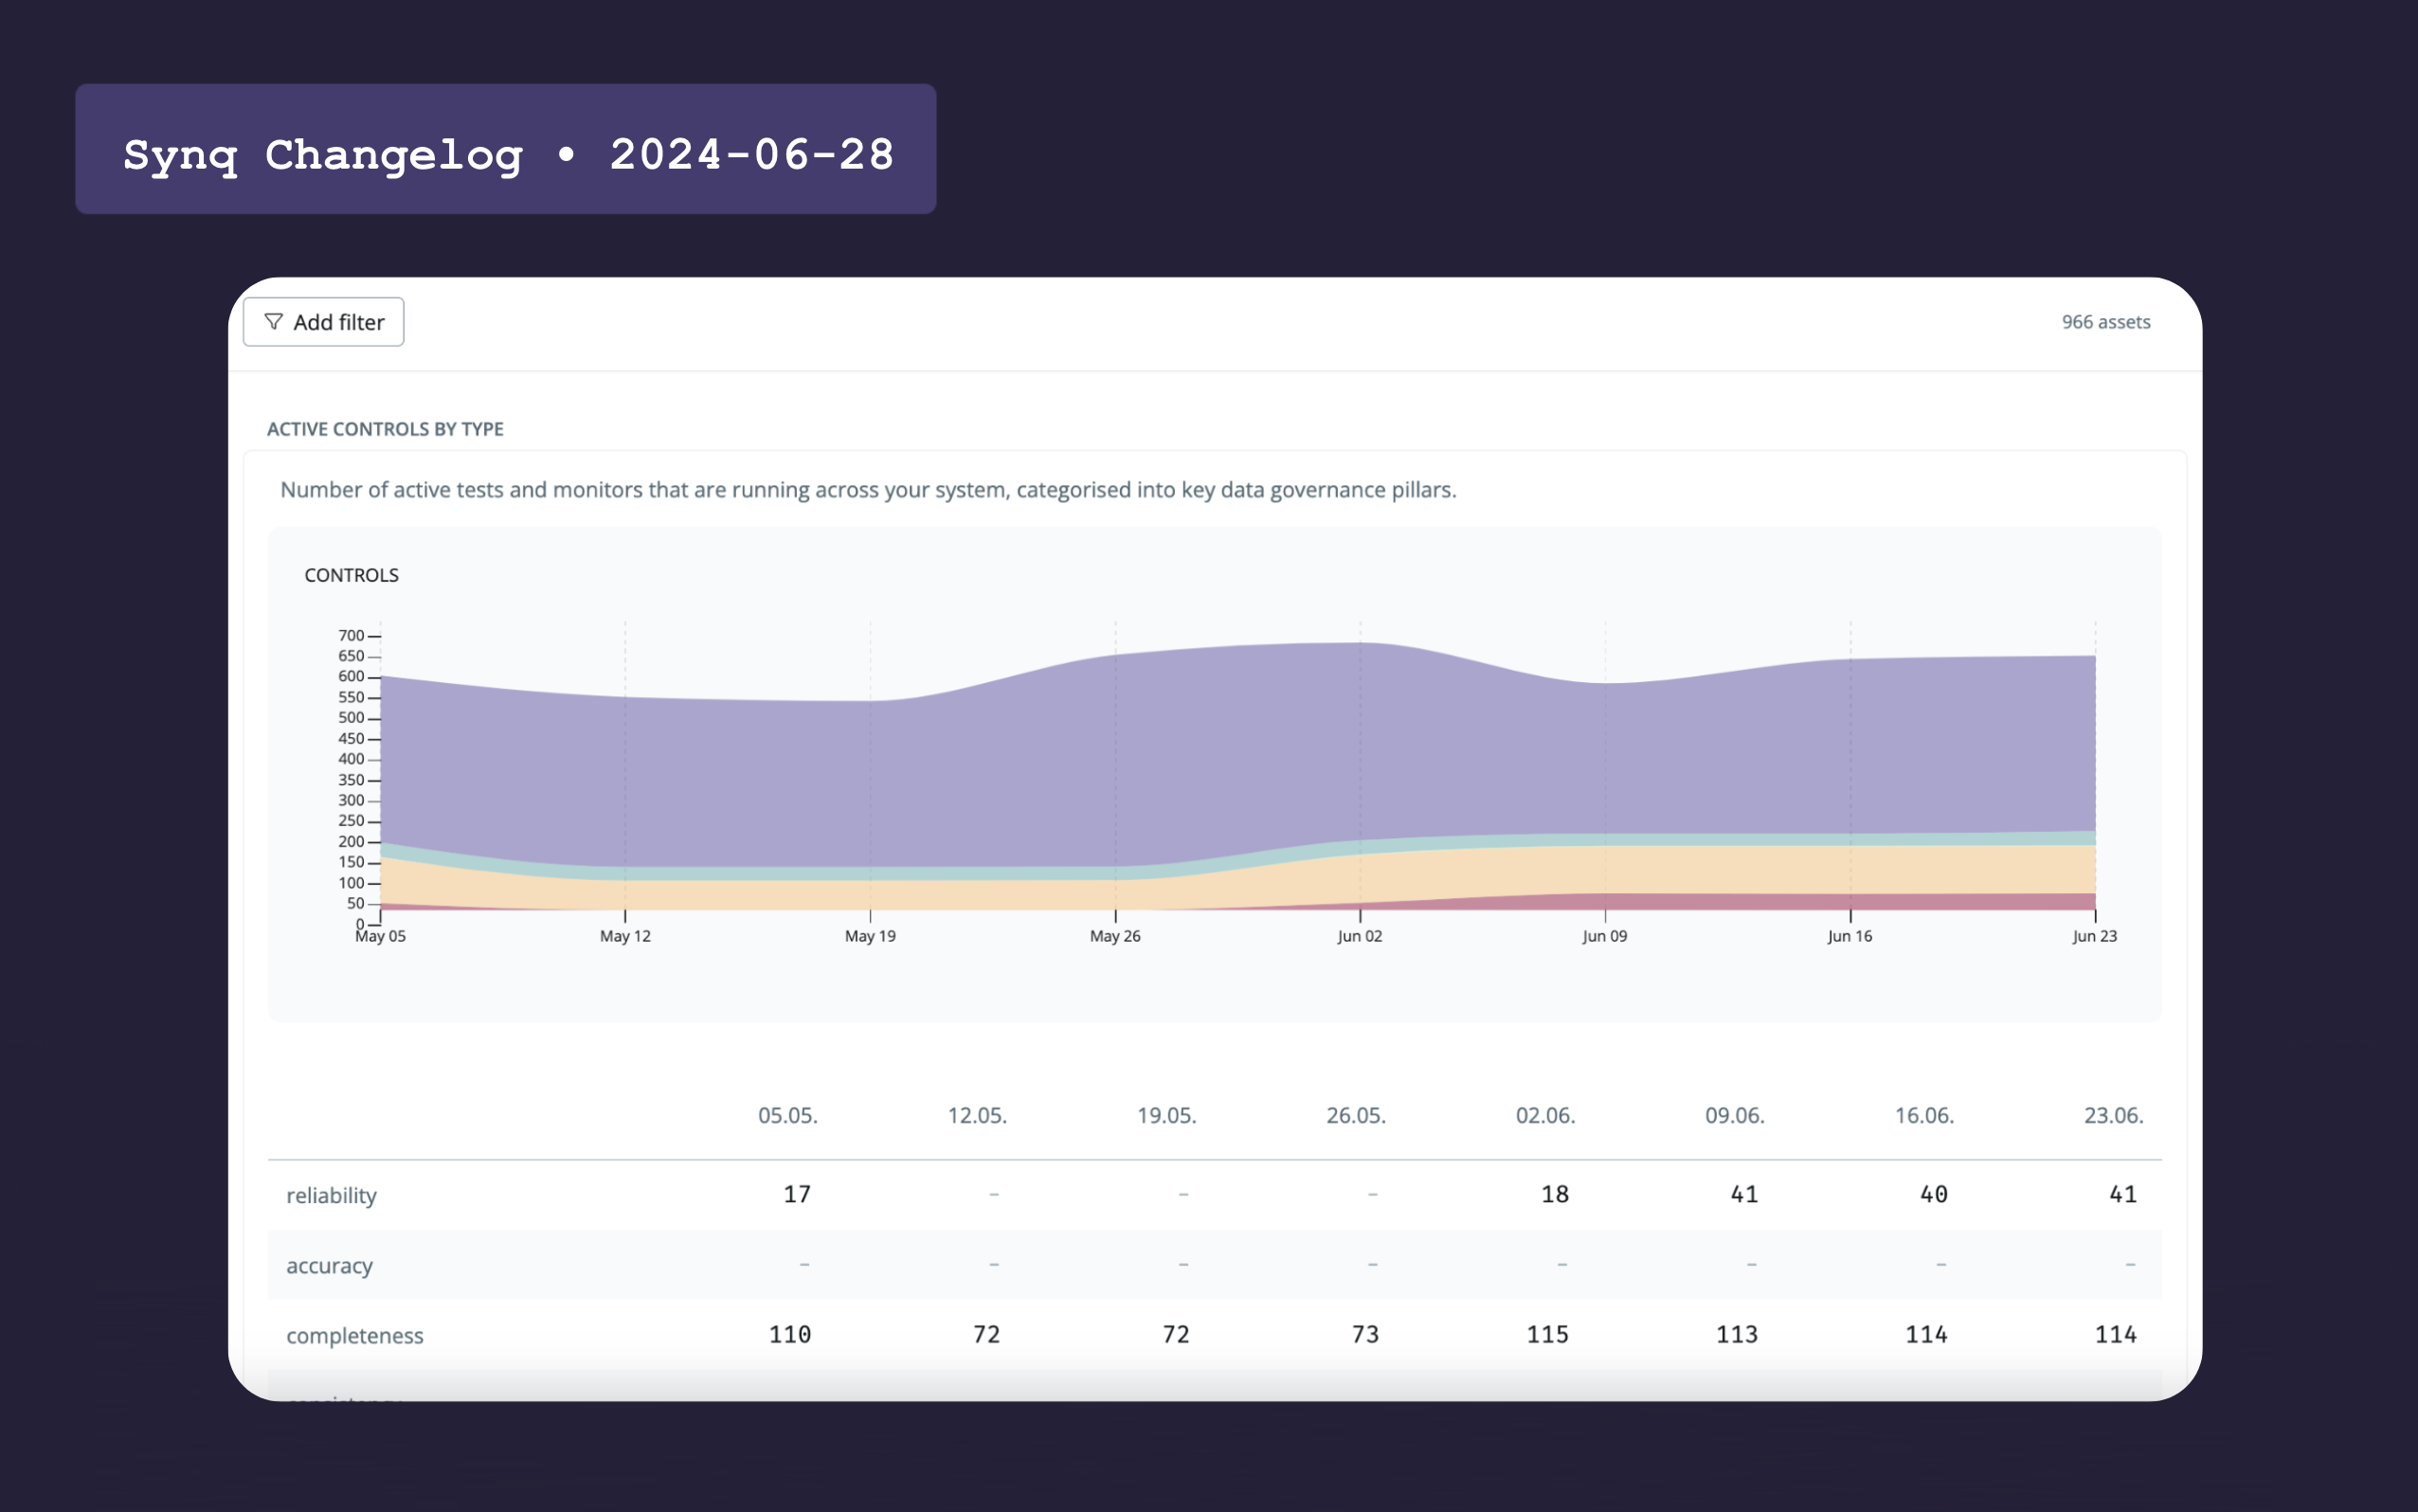
Synq analytics, new API capabilities, and refreshed UI
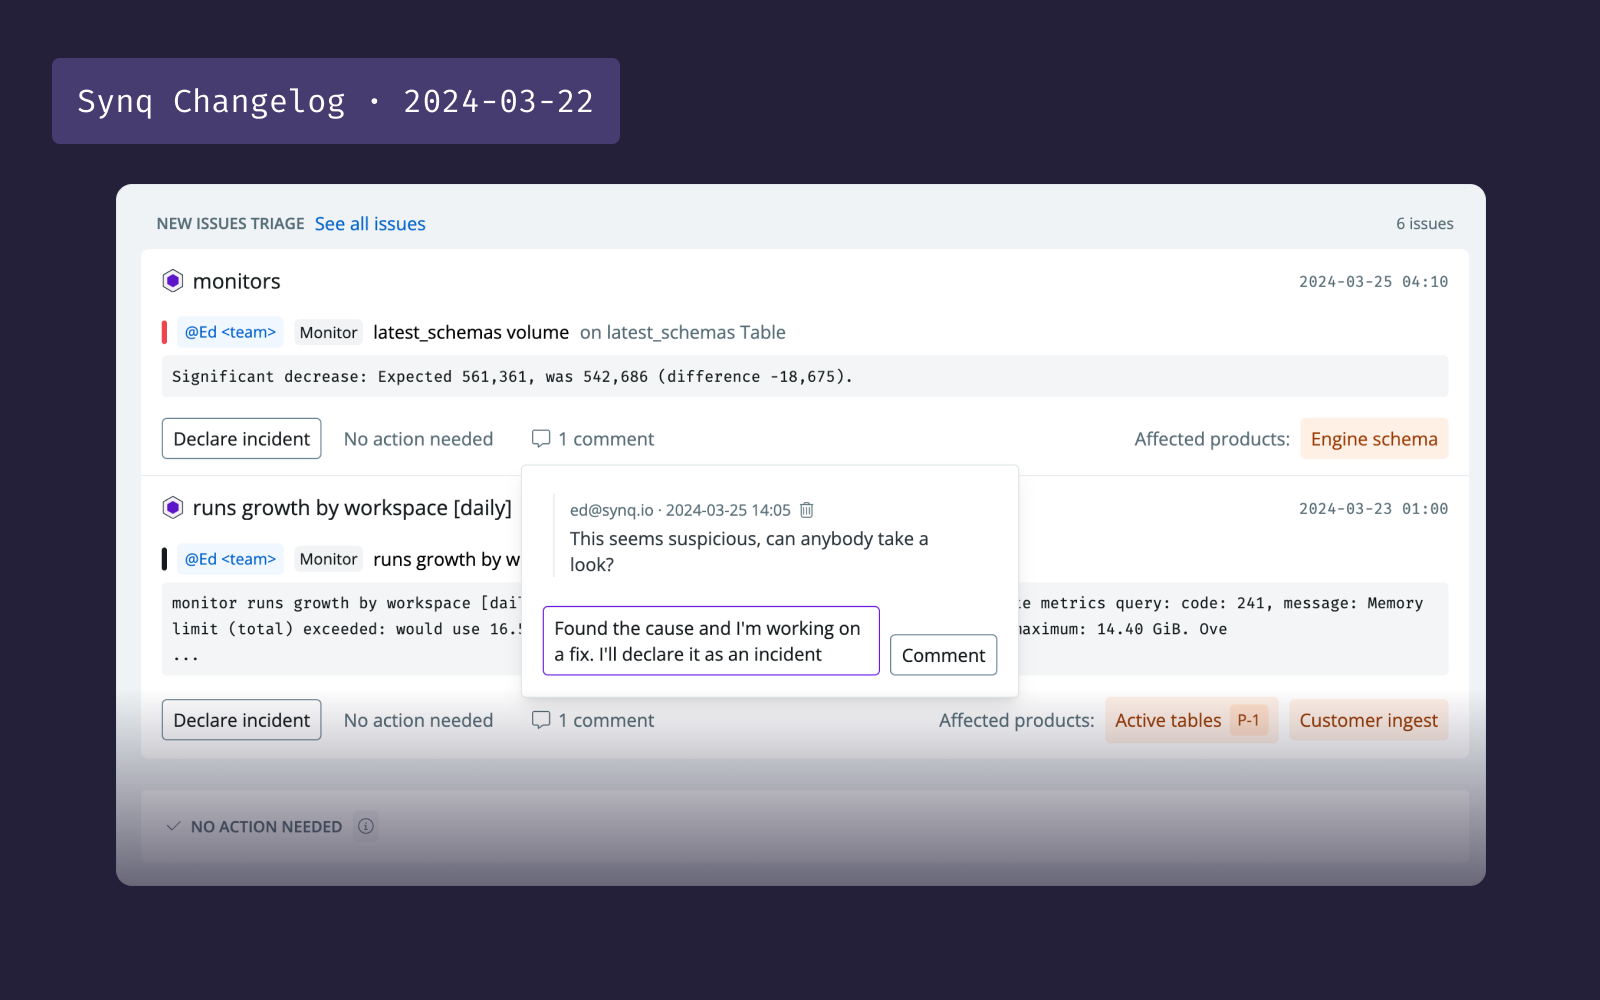
Anomalies are now issues
And you can caw see affected data products per issue in triage.
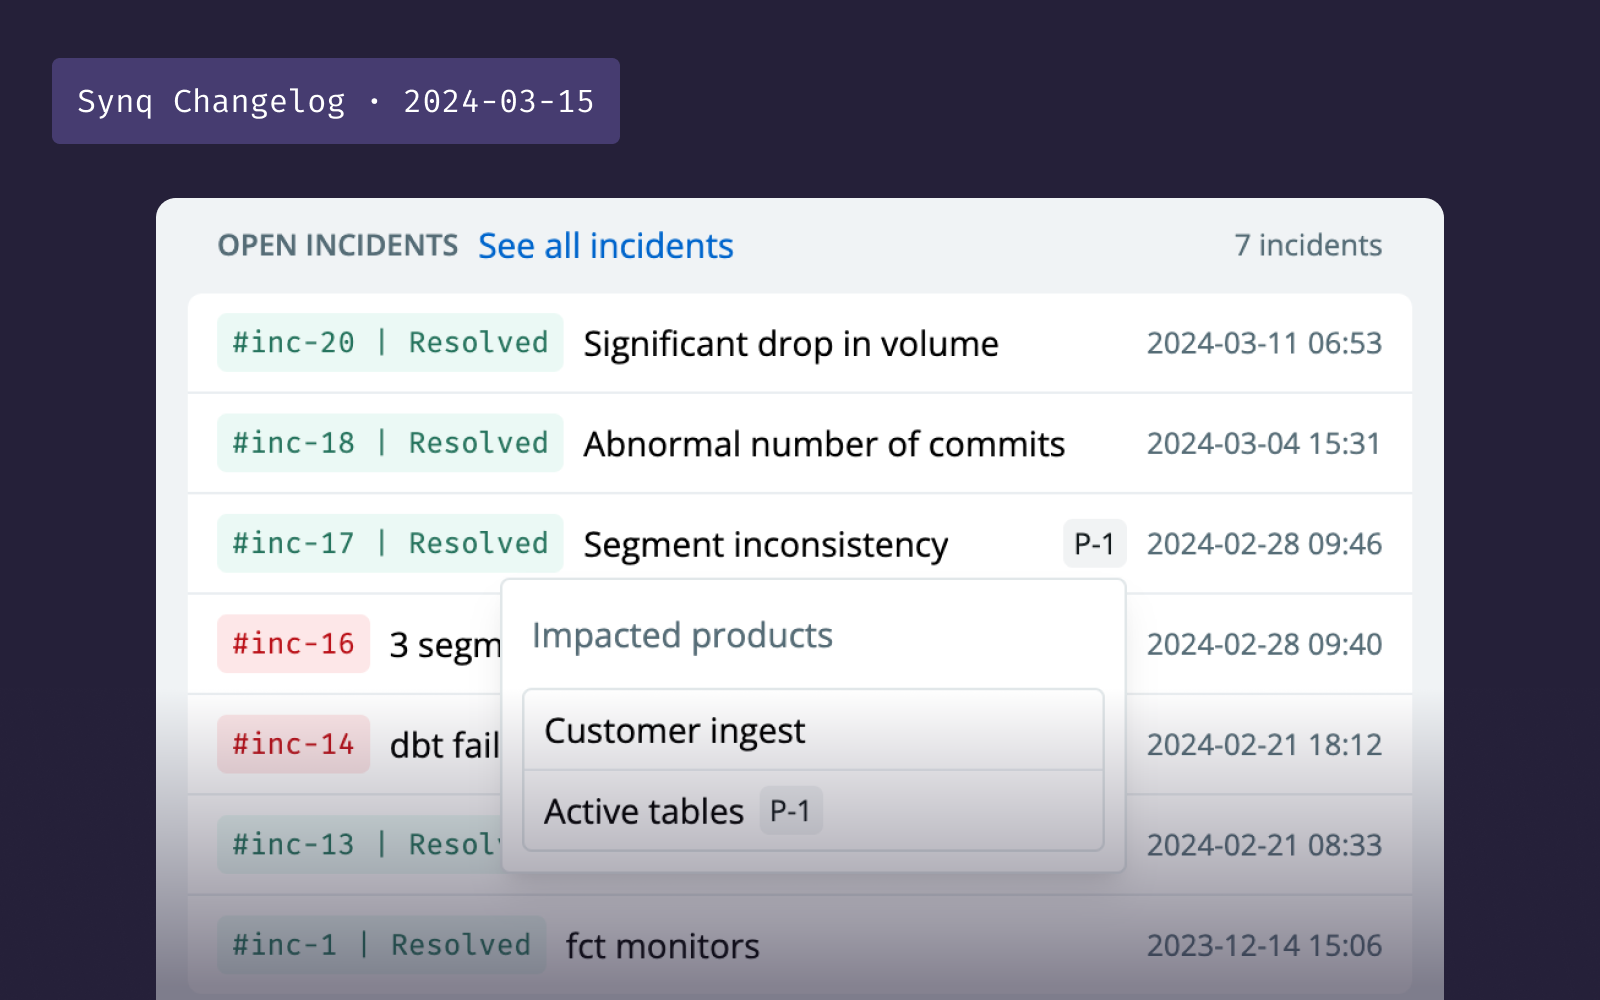
Slack alerts link to incidents and STRUCT fields
Alerts in Slack link directly to declared incidents and column-level lineage for STRUCT fields.
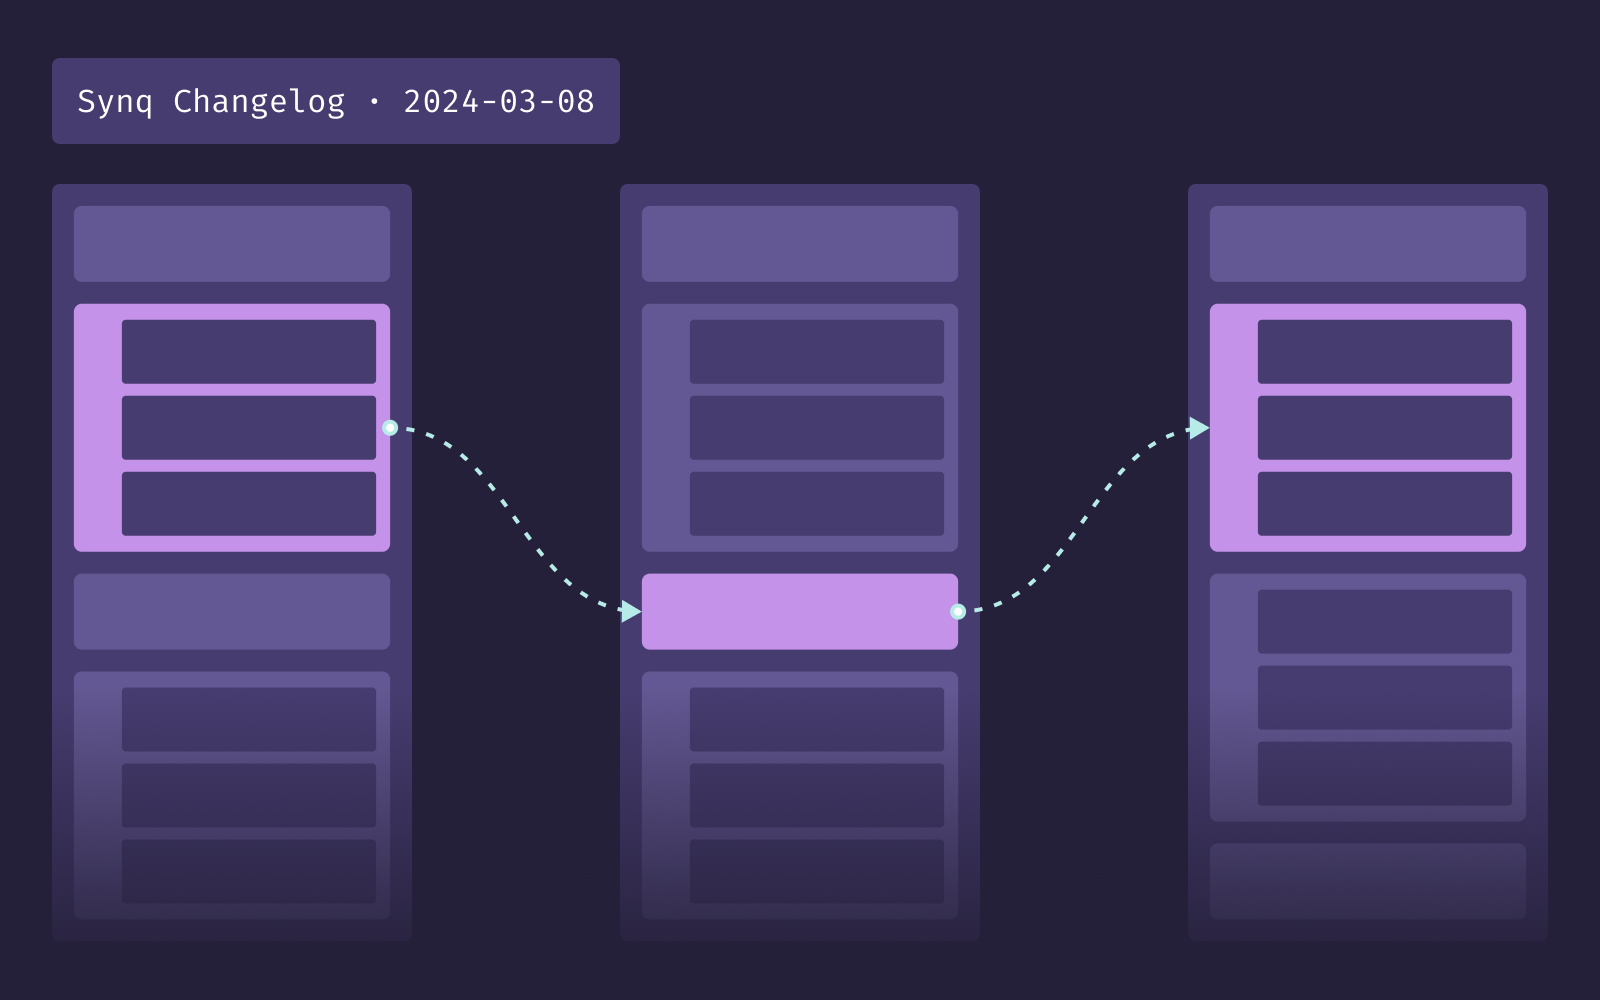
More accurate calculation of issues in data products
And Redshift query logs.
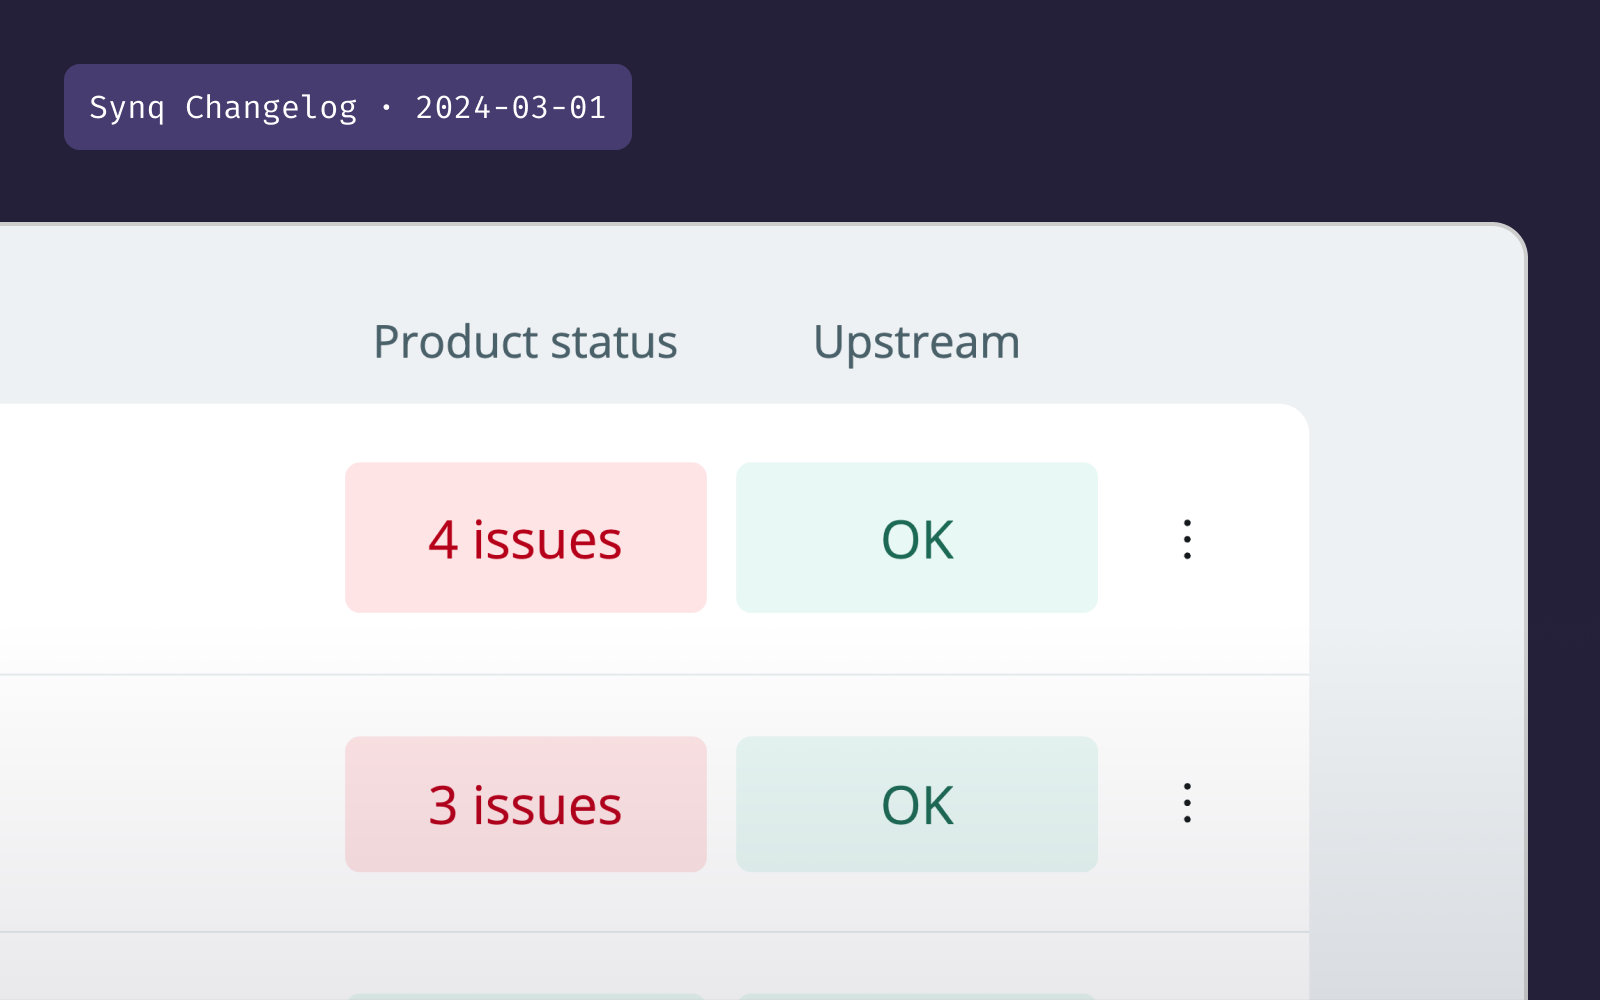
See incidents affecting your data products
Detailed lists of the impact of issues, more control in triage, and better parsing of BigQuery.

Column lineage for sharded tables
You can now see the column lineage of your BigQuery sharded tables in Synq.

Support for Postgres
One of the most popular transactional databases joins our family of integrations and more updates to incident management.
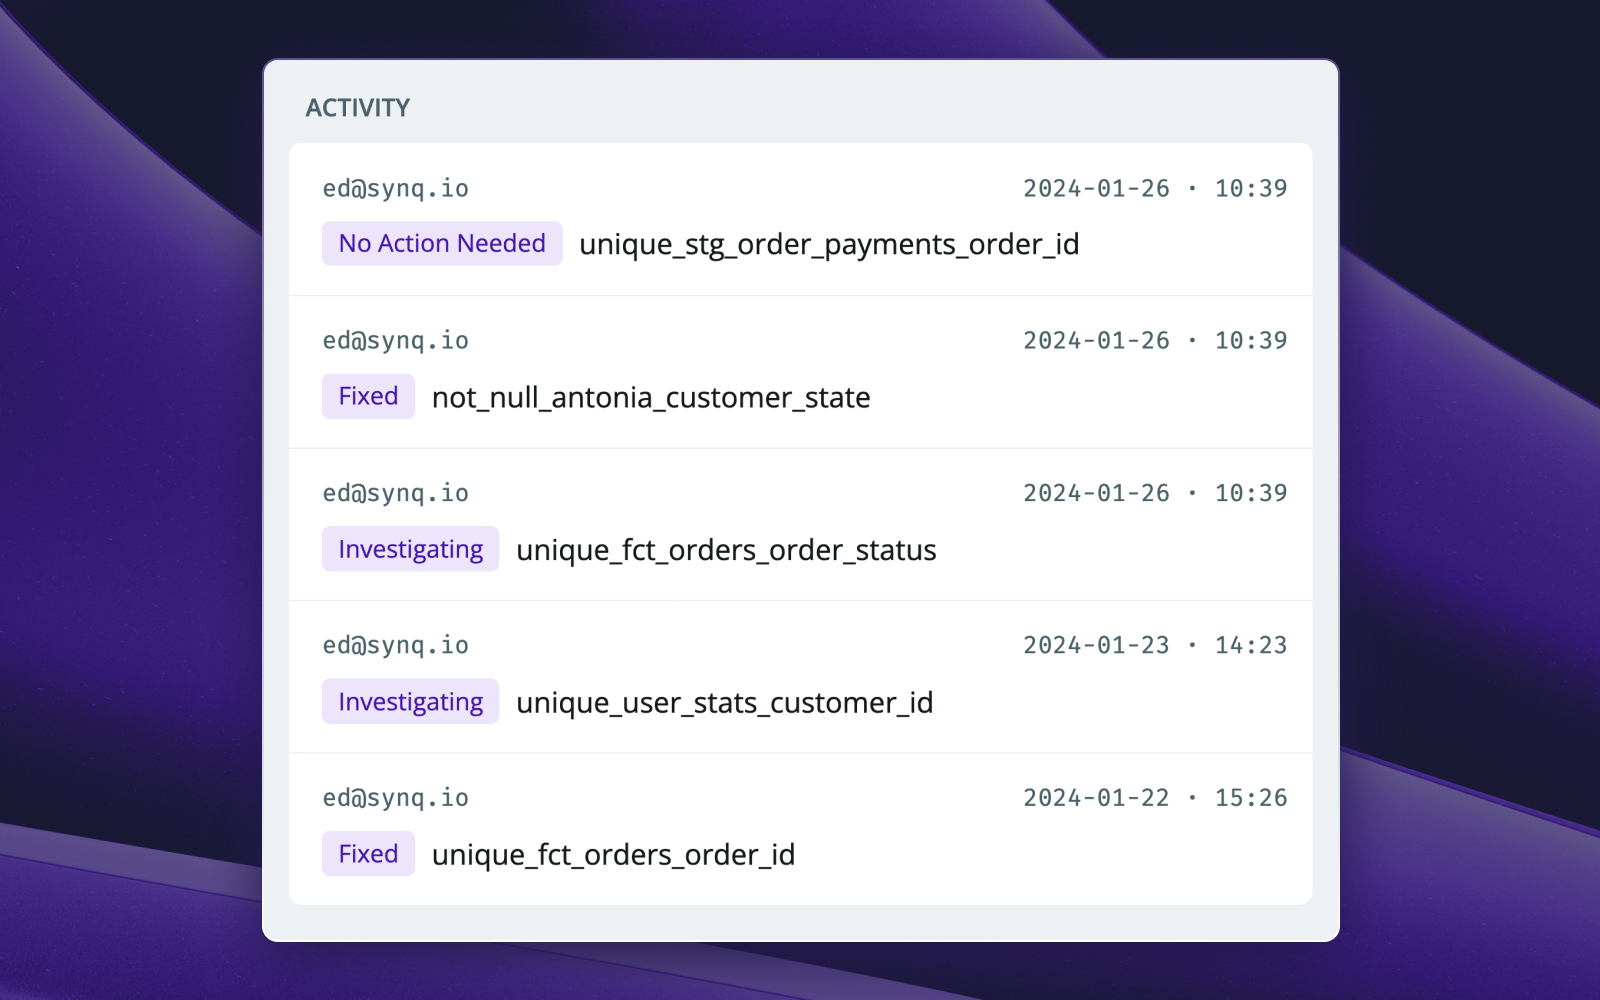
Rename incidents and see issues in specific dates.
Small updates to help you better track incidents and review past issues.

A centralized view for the status of incidents
We made it easier to see the status of issues and added support for sharded tables in BigQuery.
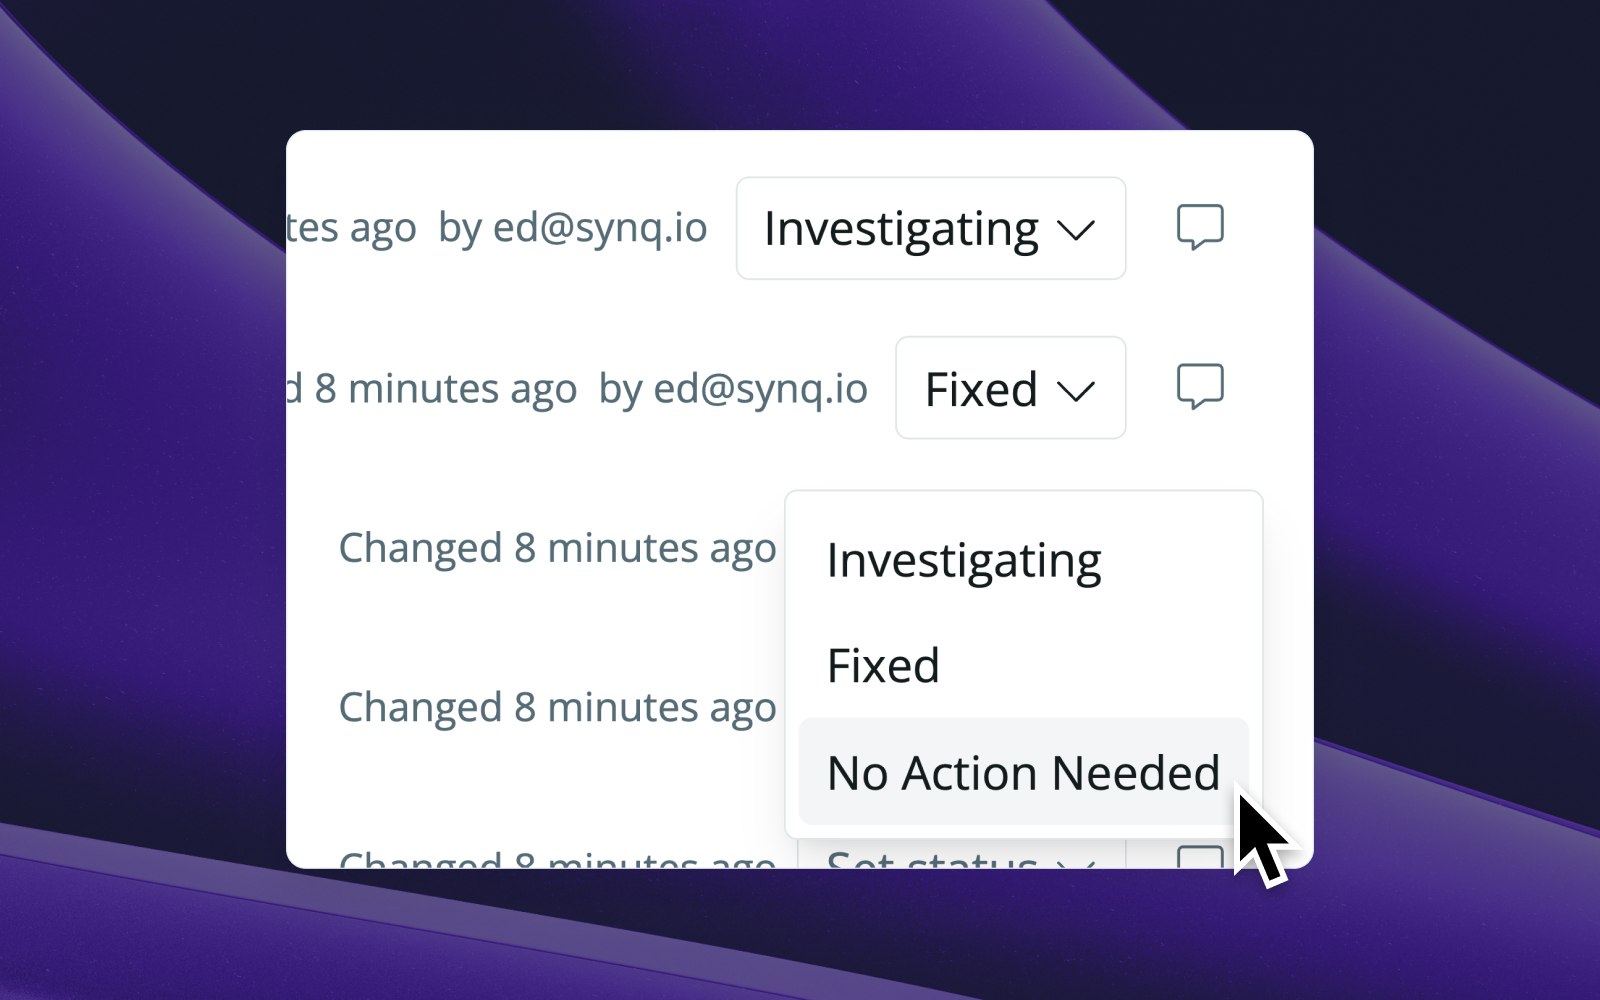
Collaborate on incidents
Add comments to incidents, see incidents affecting products, history view, and more.
Jump to products, owners, and incidents directly from Search.
Do more with search, filter product issues and see products in lineage preview

A sneak peek into our new incident management
Manage the incident-resolution workflow —from impact assessment to triaging and root-cause analysis— in one interface.

Ownership-based alerting
We made it easier to receive alerts you care about based on ownership and severity levels
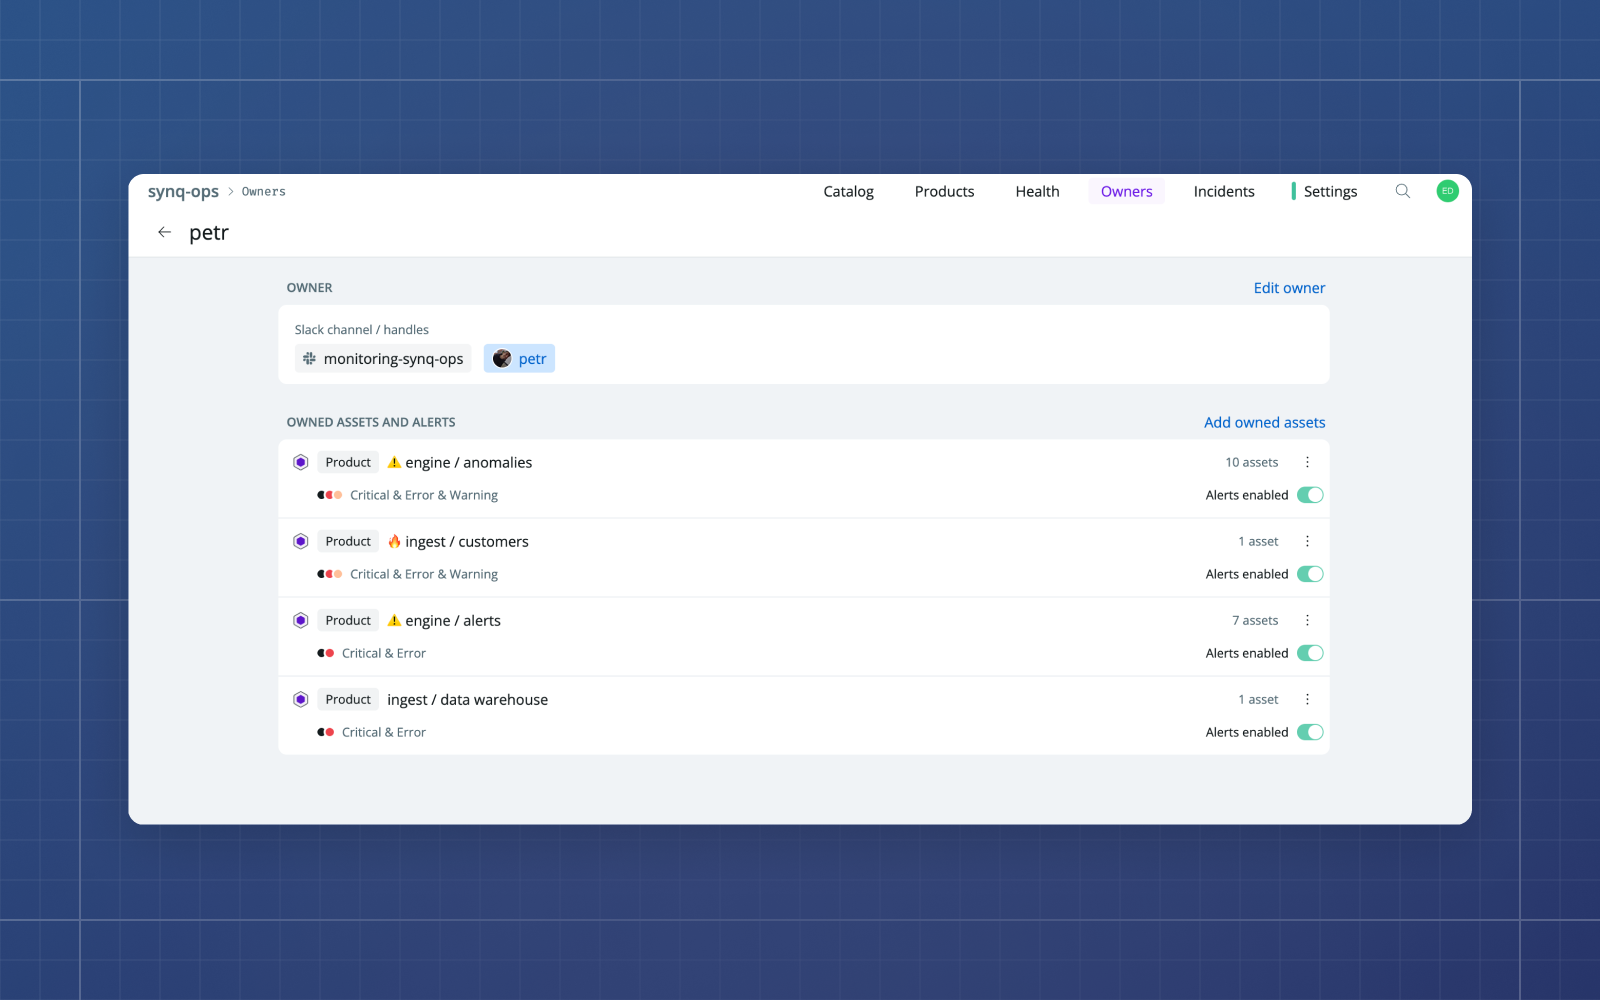
Get to data product issues faster
Issues related to your products are now one click away.
Brand-new search
Fuzzy search and the ability to search across columns and descriptions.
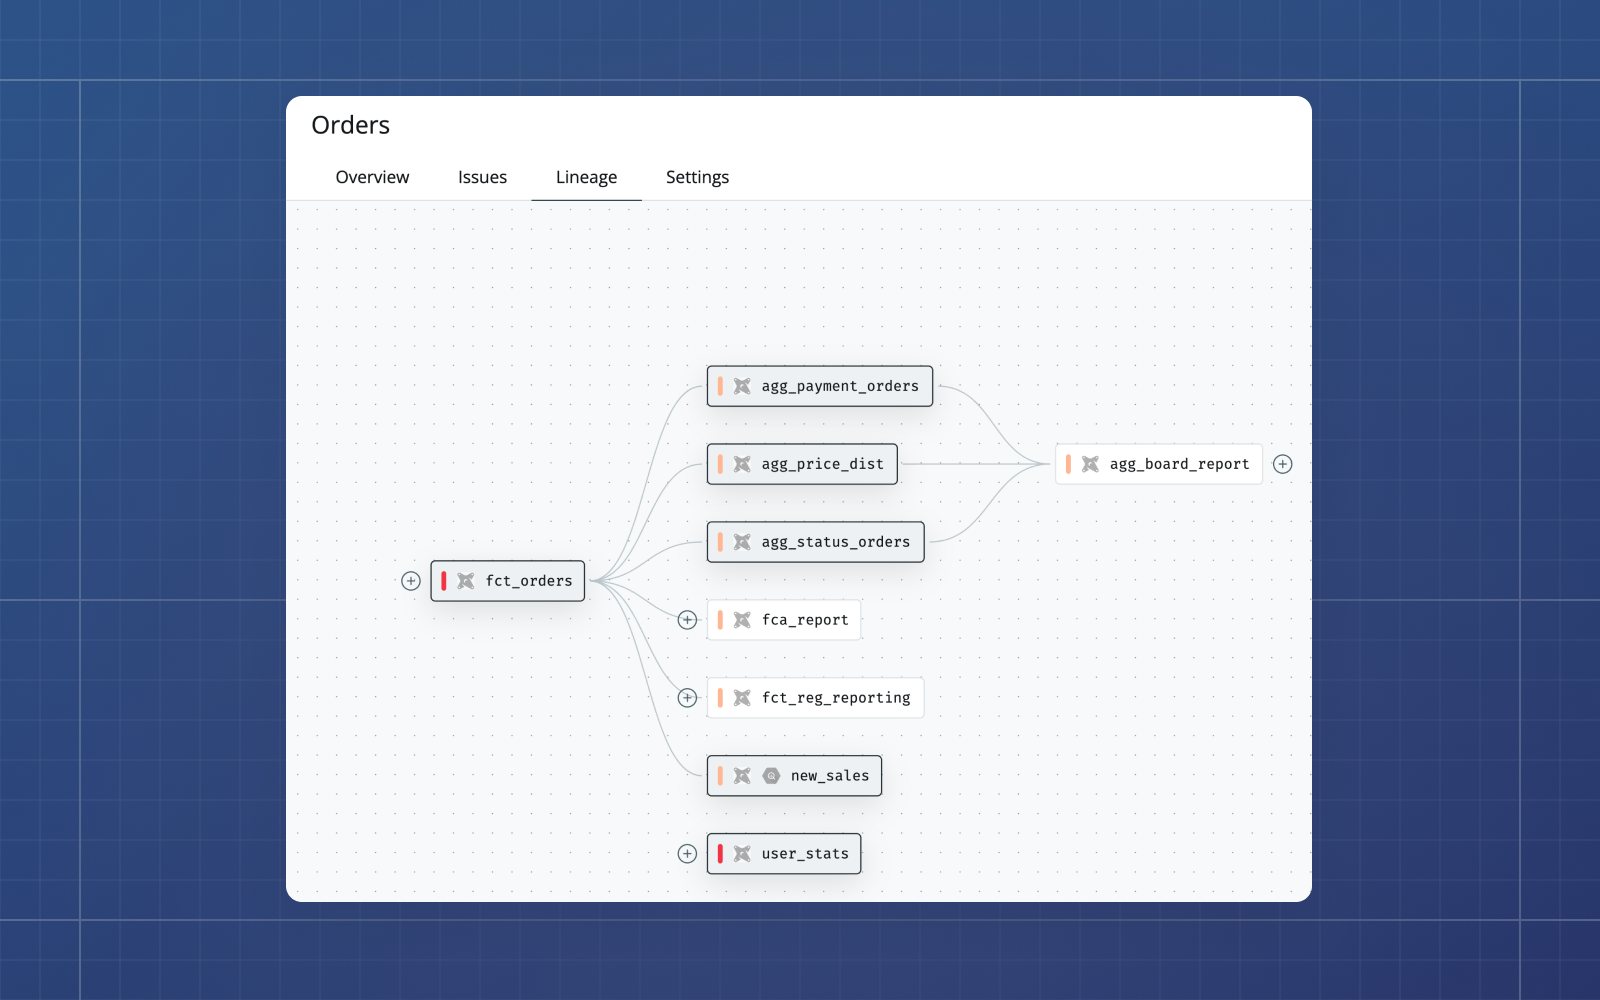
Unification of models and tables statuses
See the status of associated assets in Overview, better Tableau integration, and more.
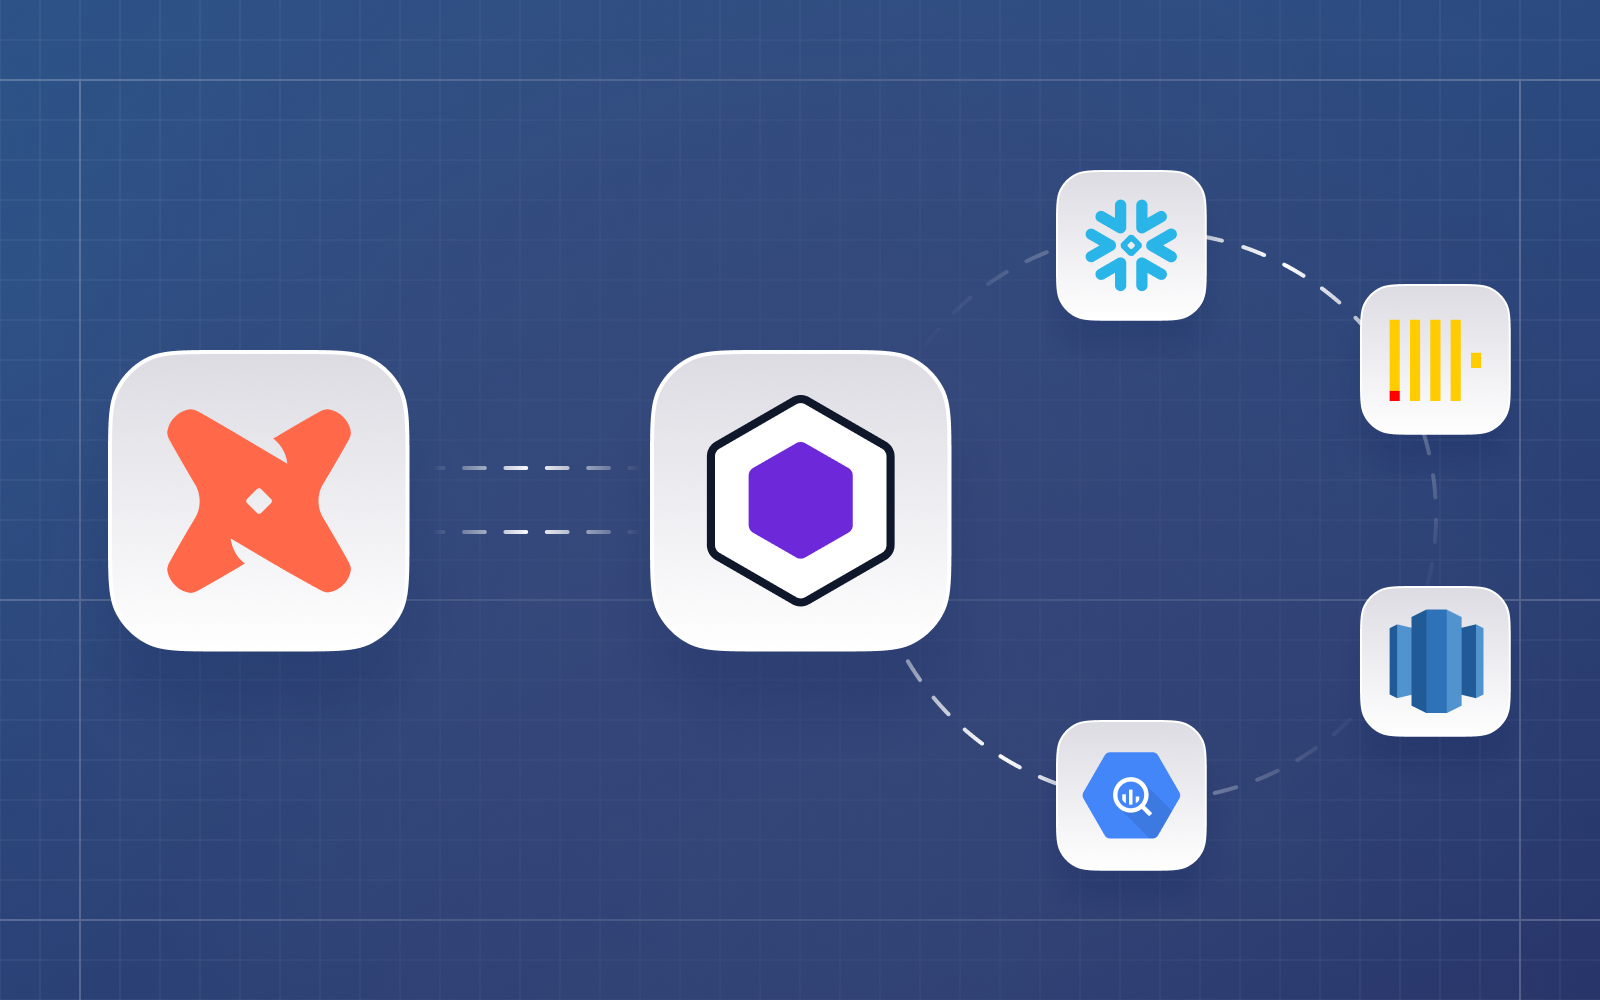
Column-level lineage is out
We are excited to finally release column-level lineage to all our customers.
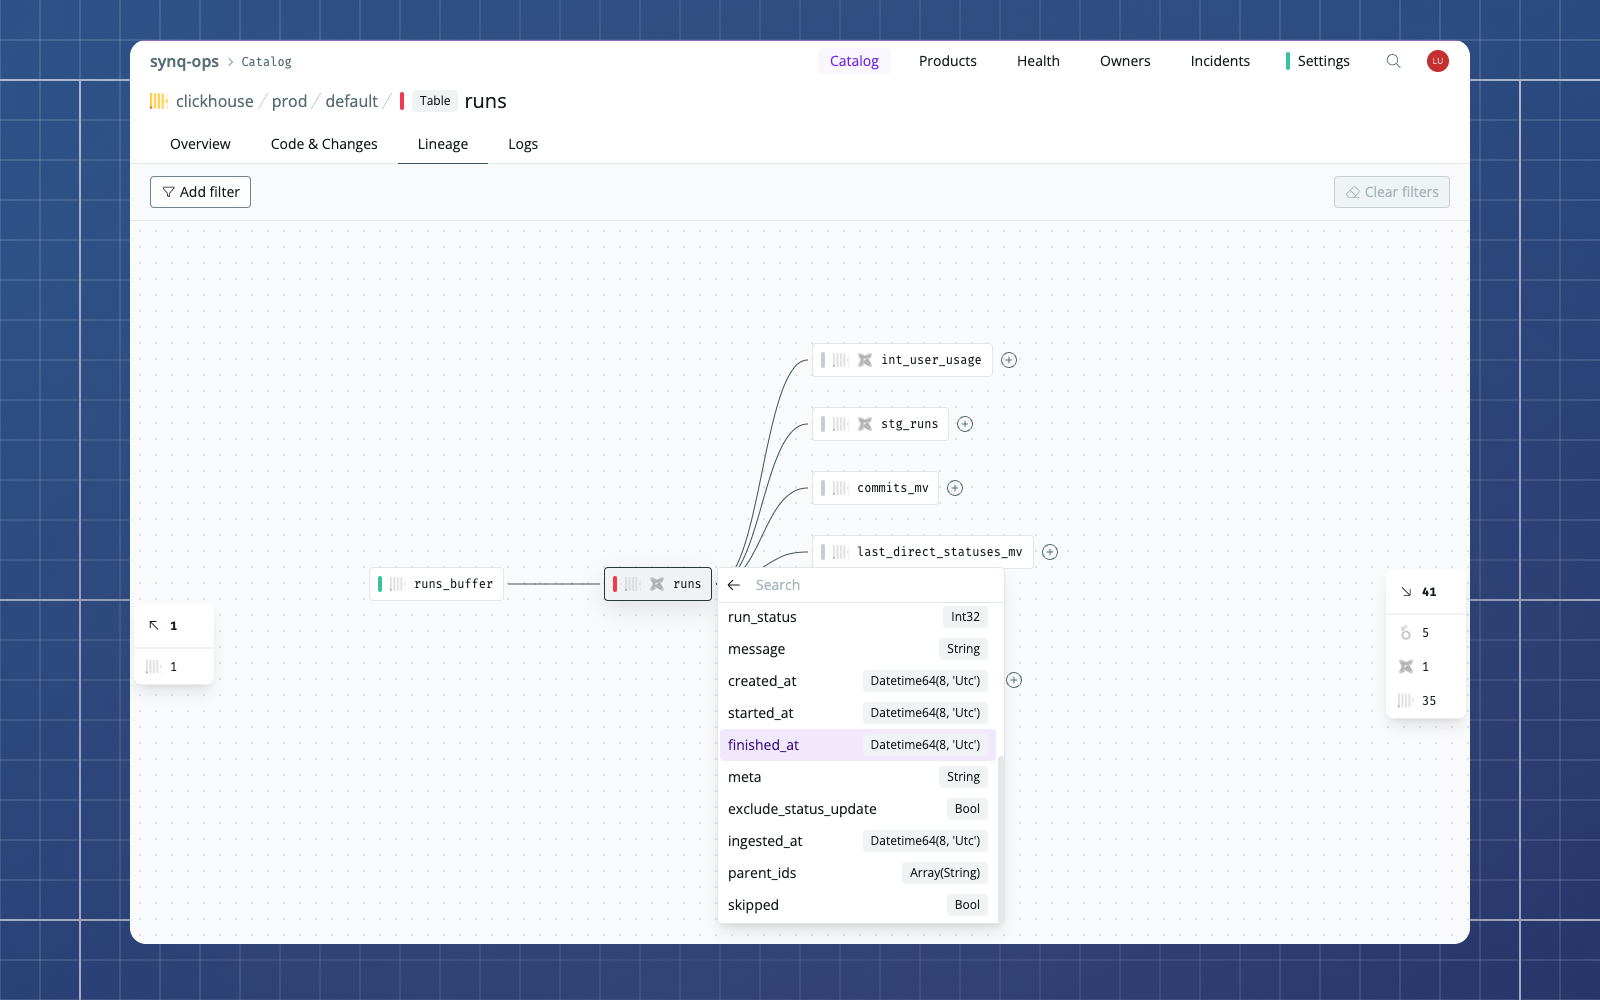
Better parsing and support for column-level lineages
This week, we made significant progress on improving our parser and analysis coverage for Snowflake, BigQuery, Redshift and Clickhouse.

Support for PIVOT functions and Data Products BETA
Snooze monitors, set a daily schedule for opt-in monitors, and a sneak peek into Data Products.
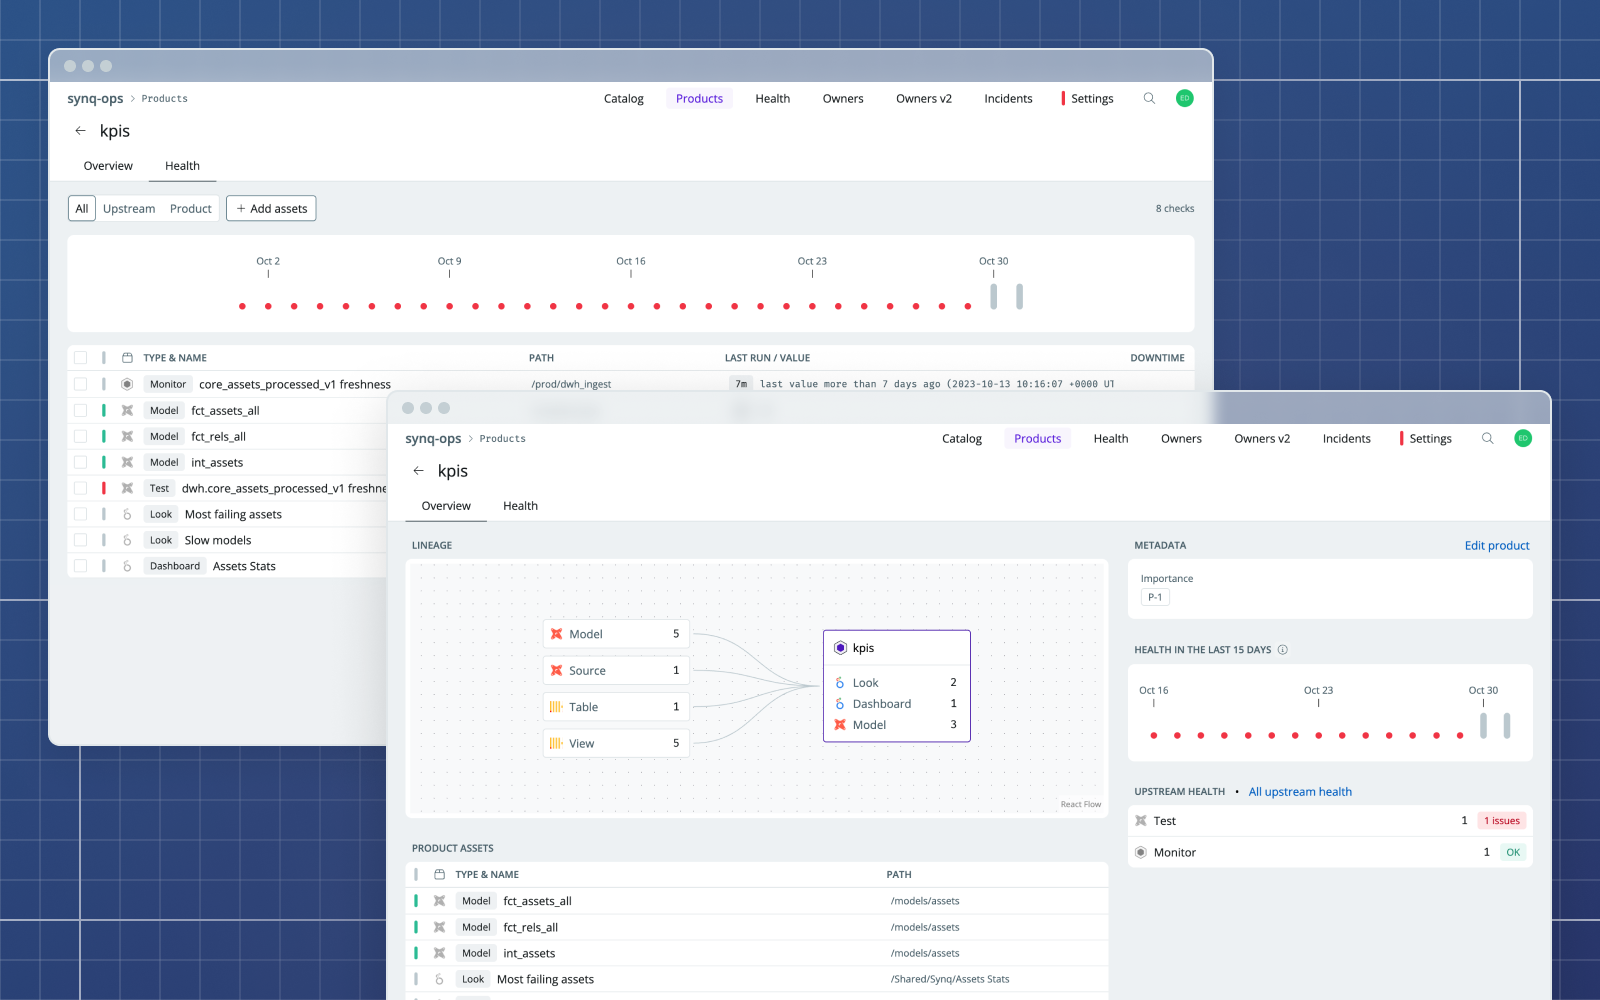
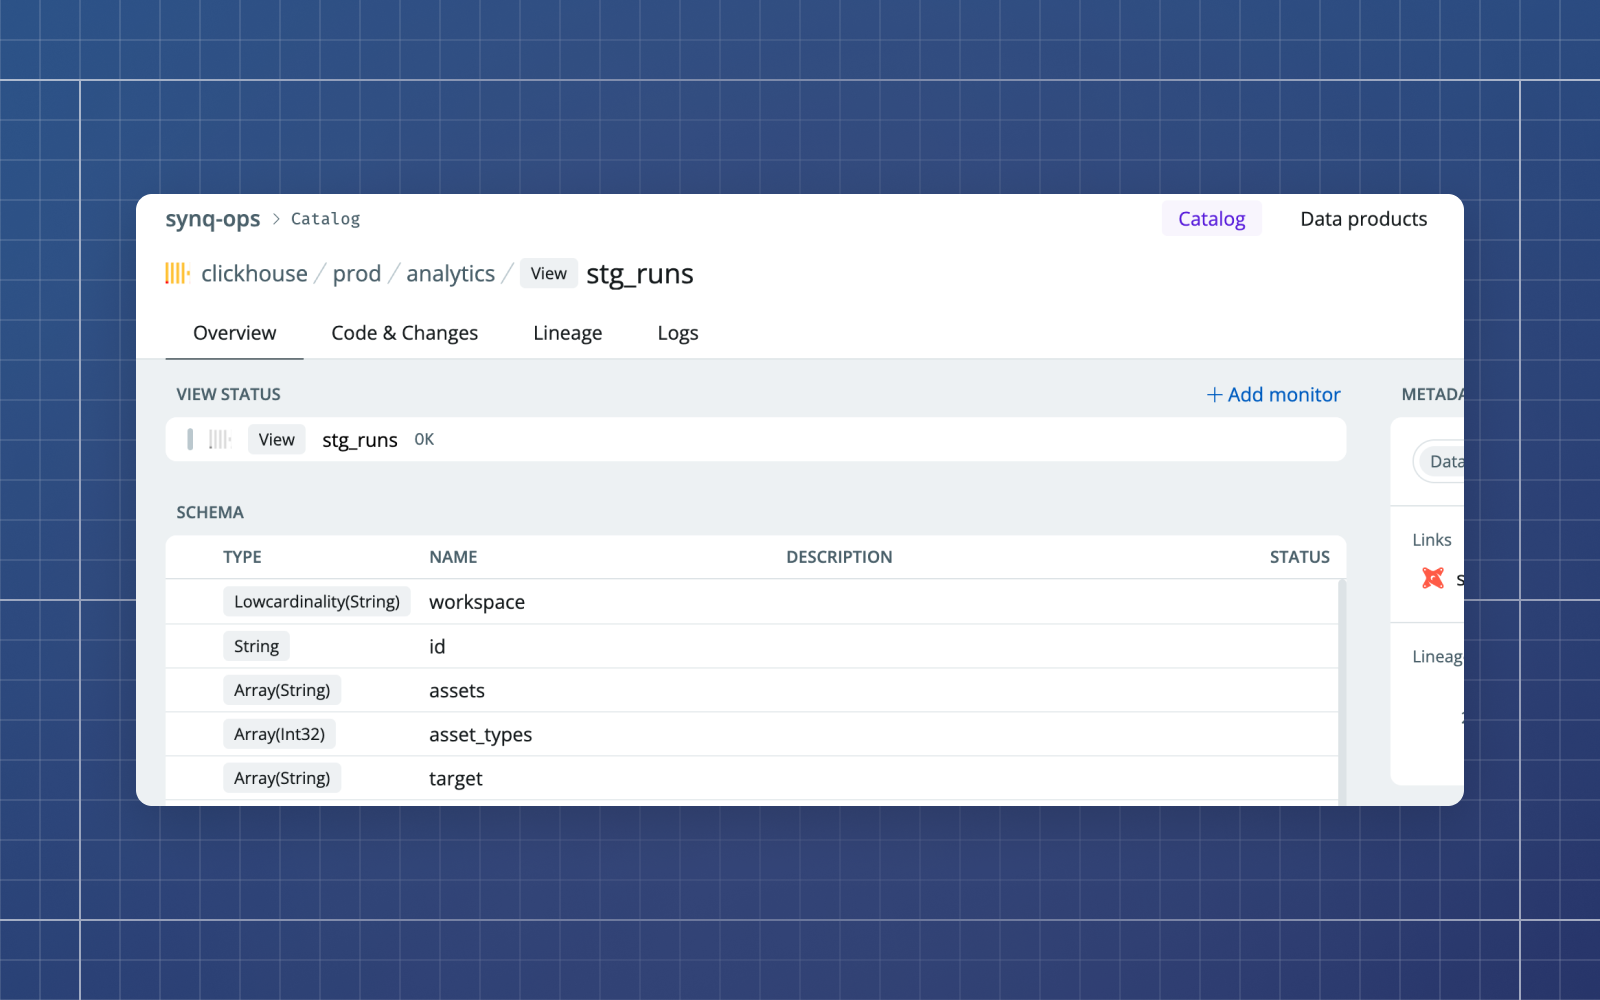
See where you are at all times
Instantly see the location of everything with paths in the header of the app.
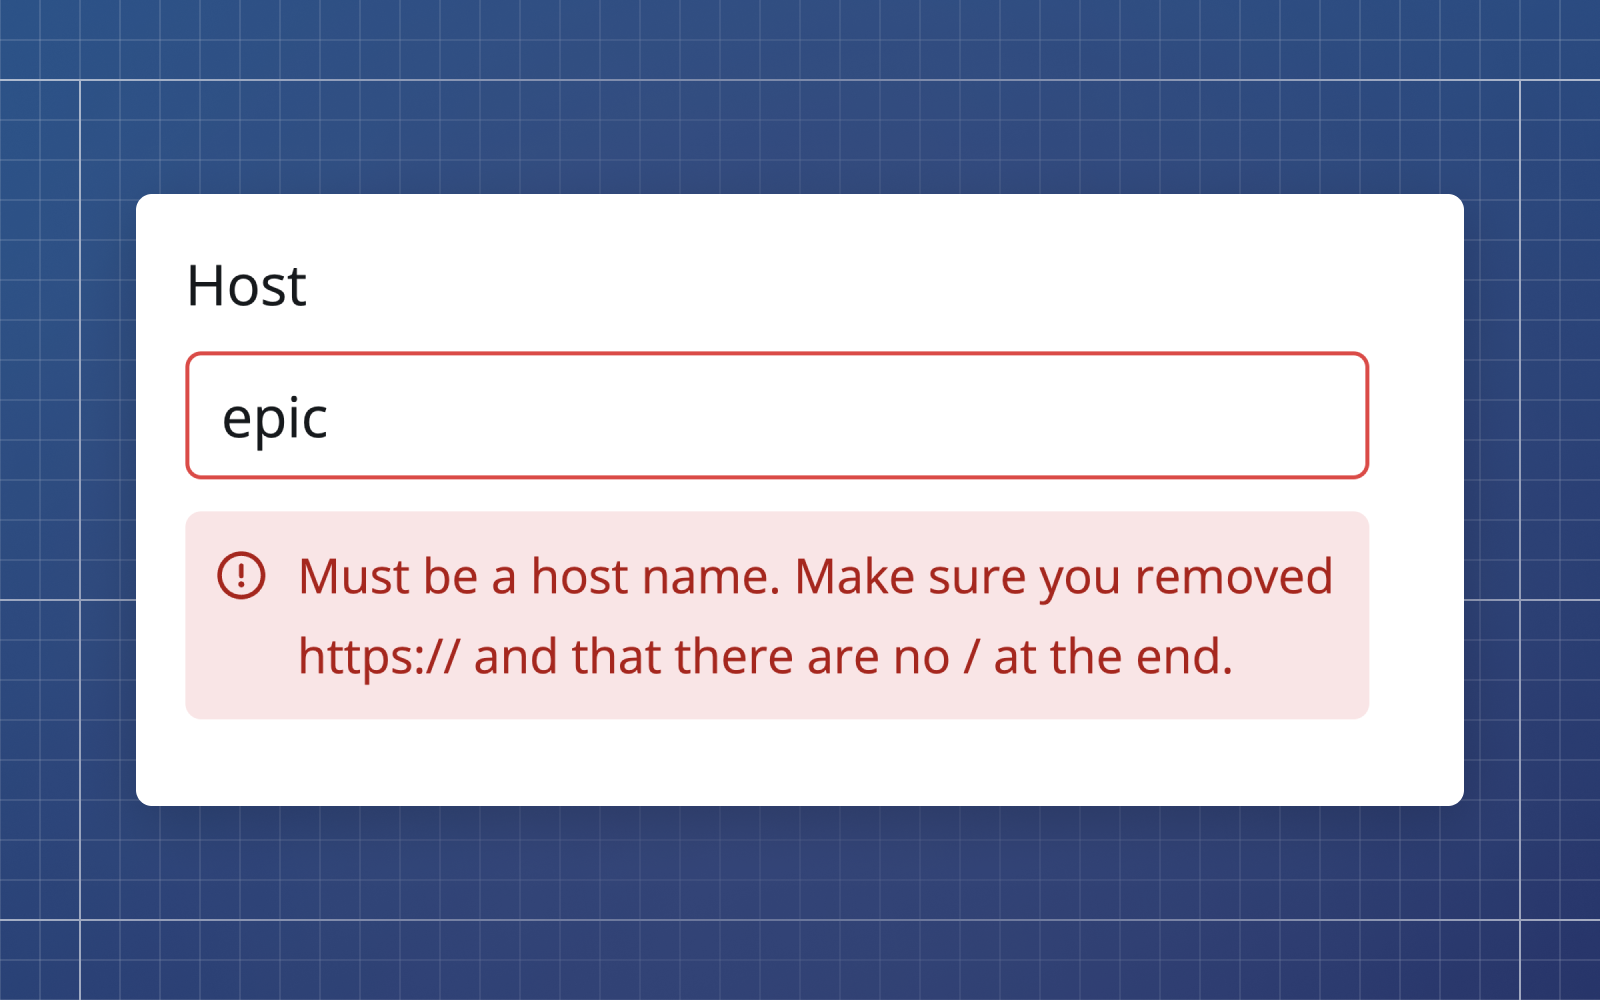
More clear error feedback in integrations
You now can also keep toasts on for longer and other functional improvements.
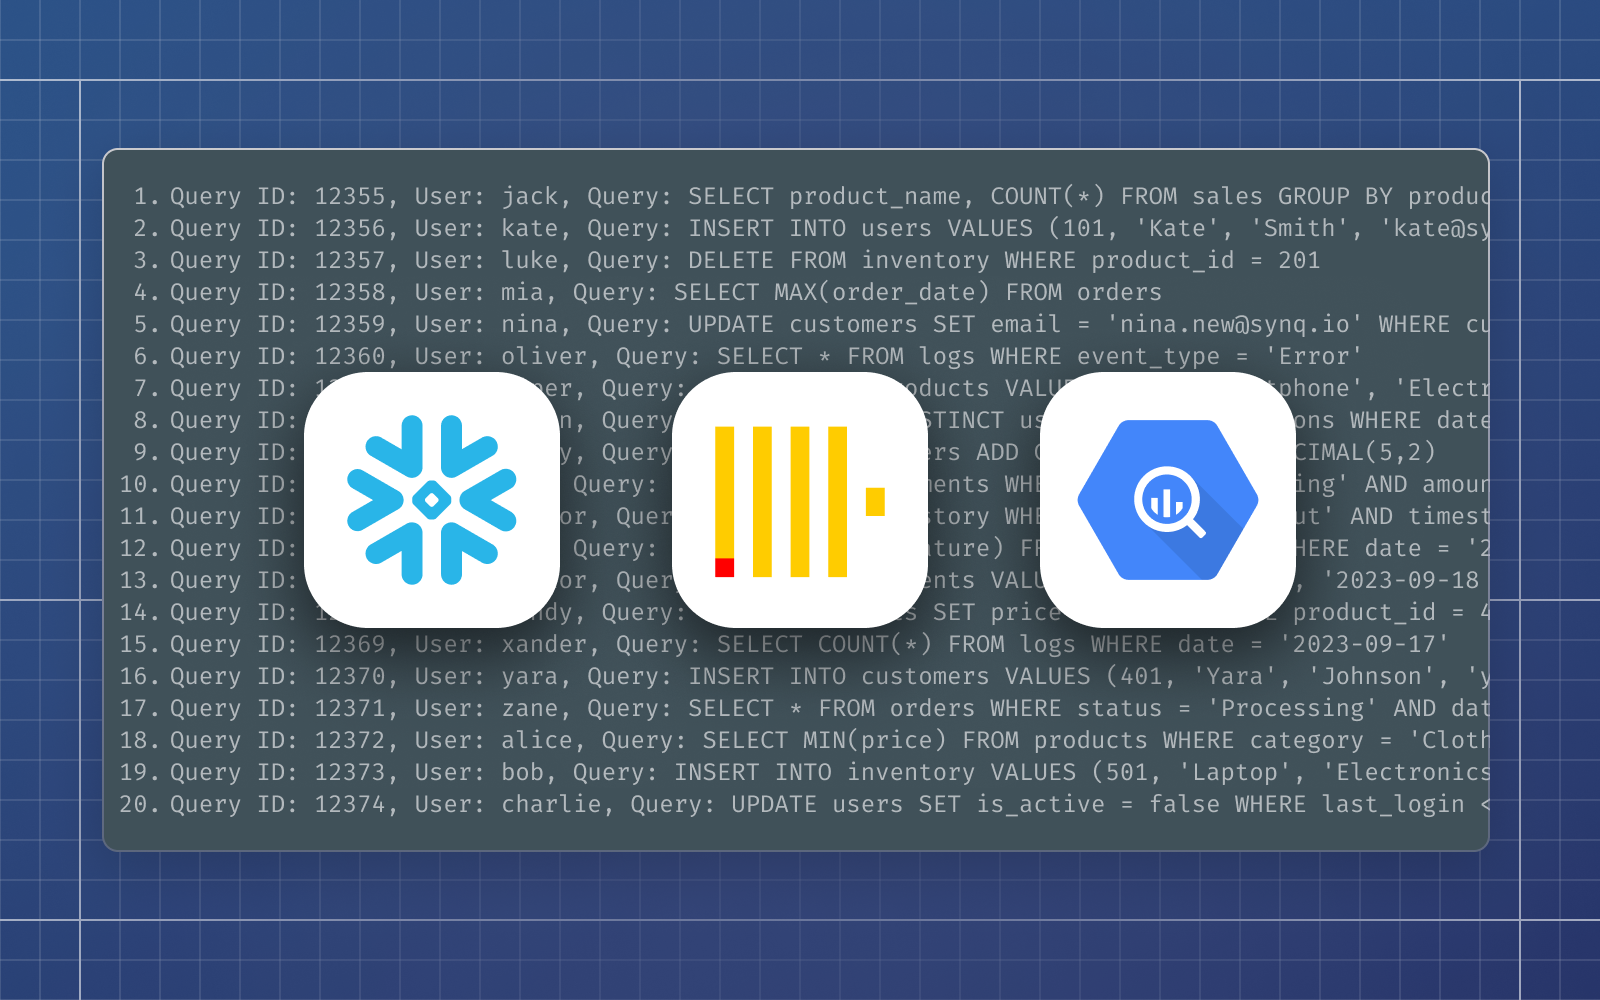
We now support warehouse query logs
Query logs help us identify costly models and boost the precision of freshness monitors.
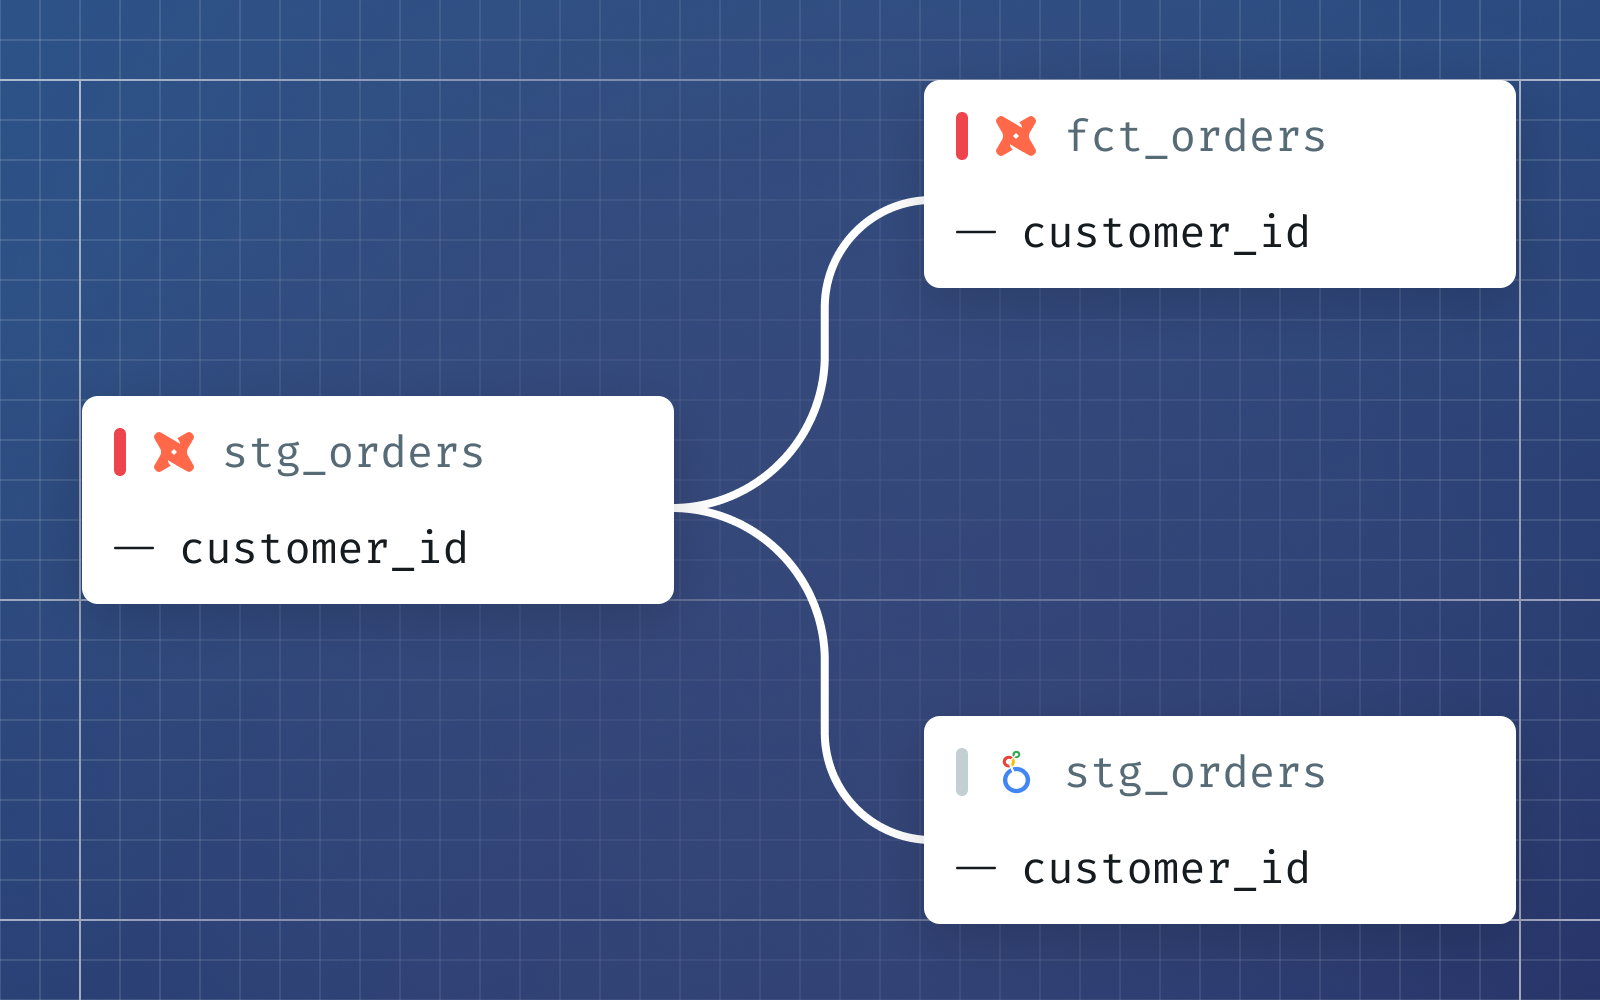
Sneak peak at our column-level lineage
Soon you will be able to trace a column across your stack.
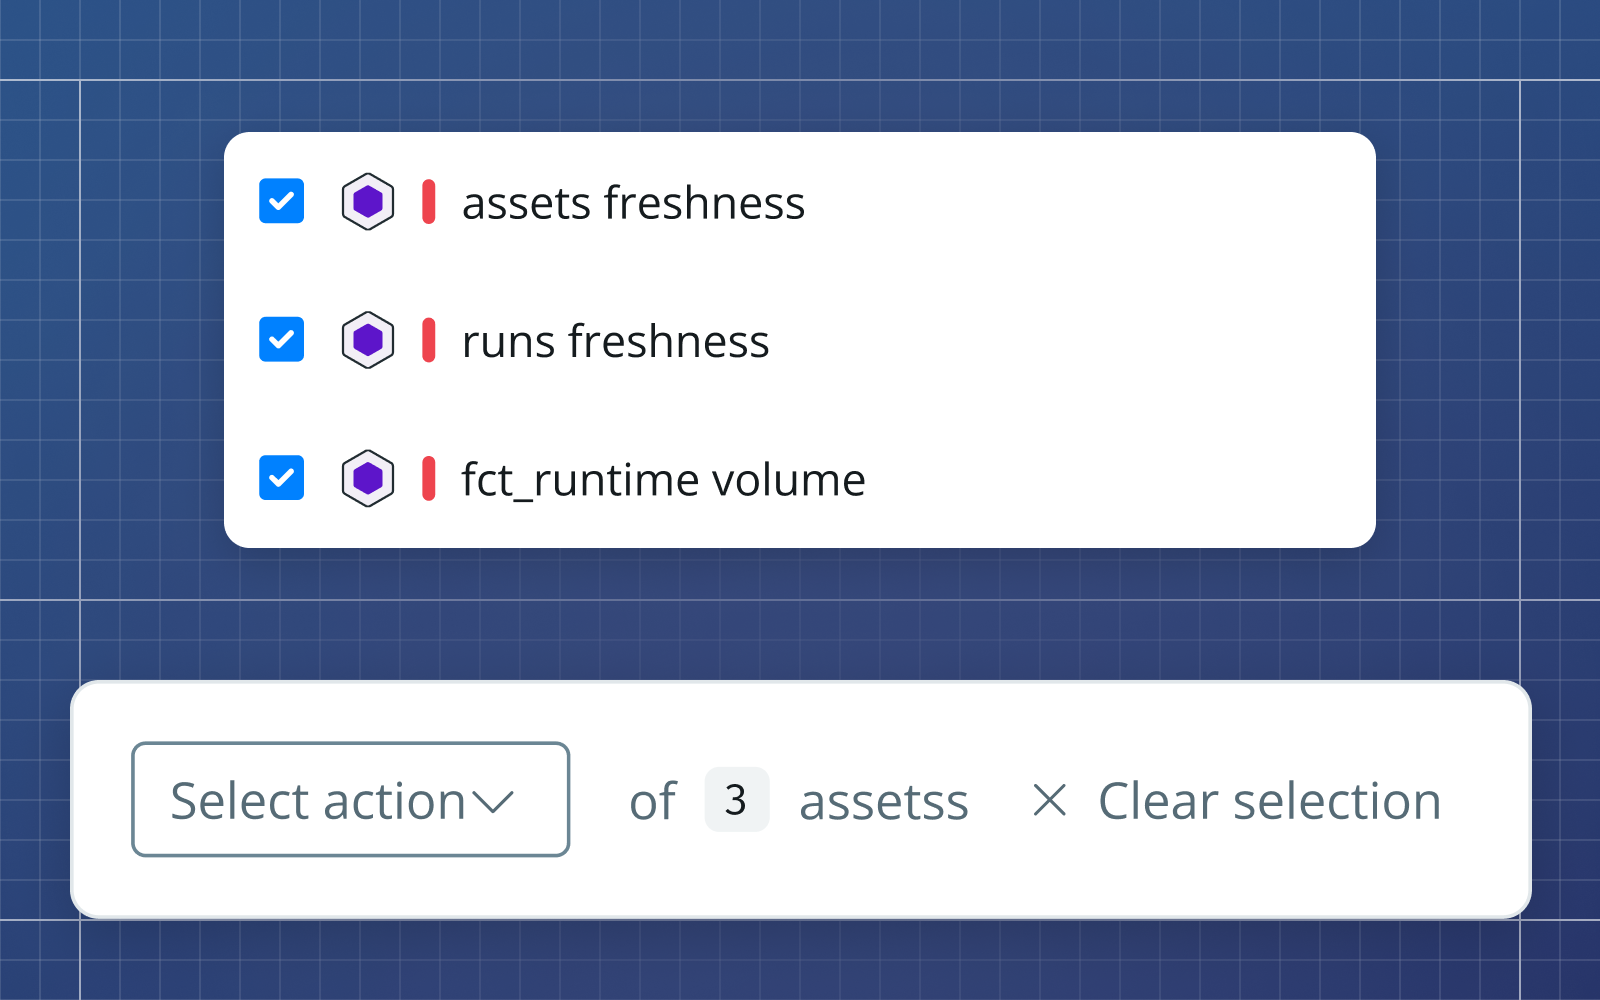
Manage anomaly monitors at scale
Mute and unmute specific monitors and tests in alerts.
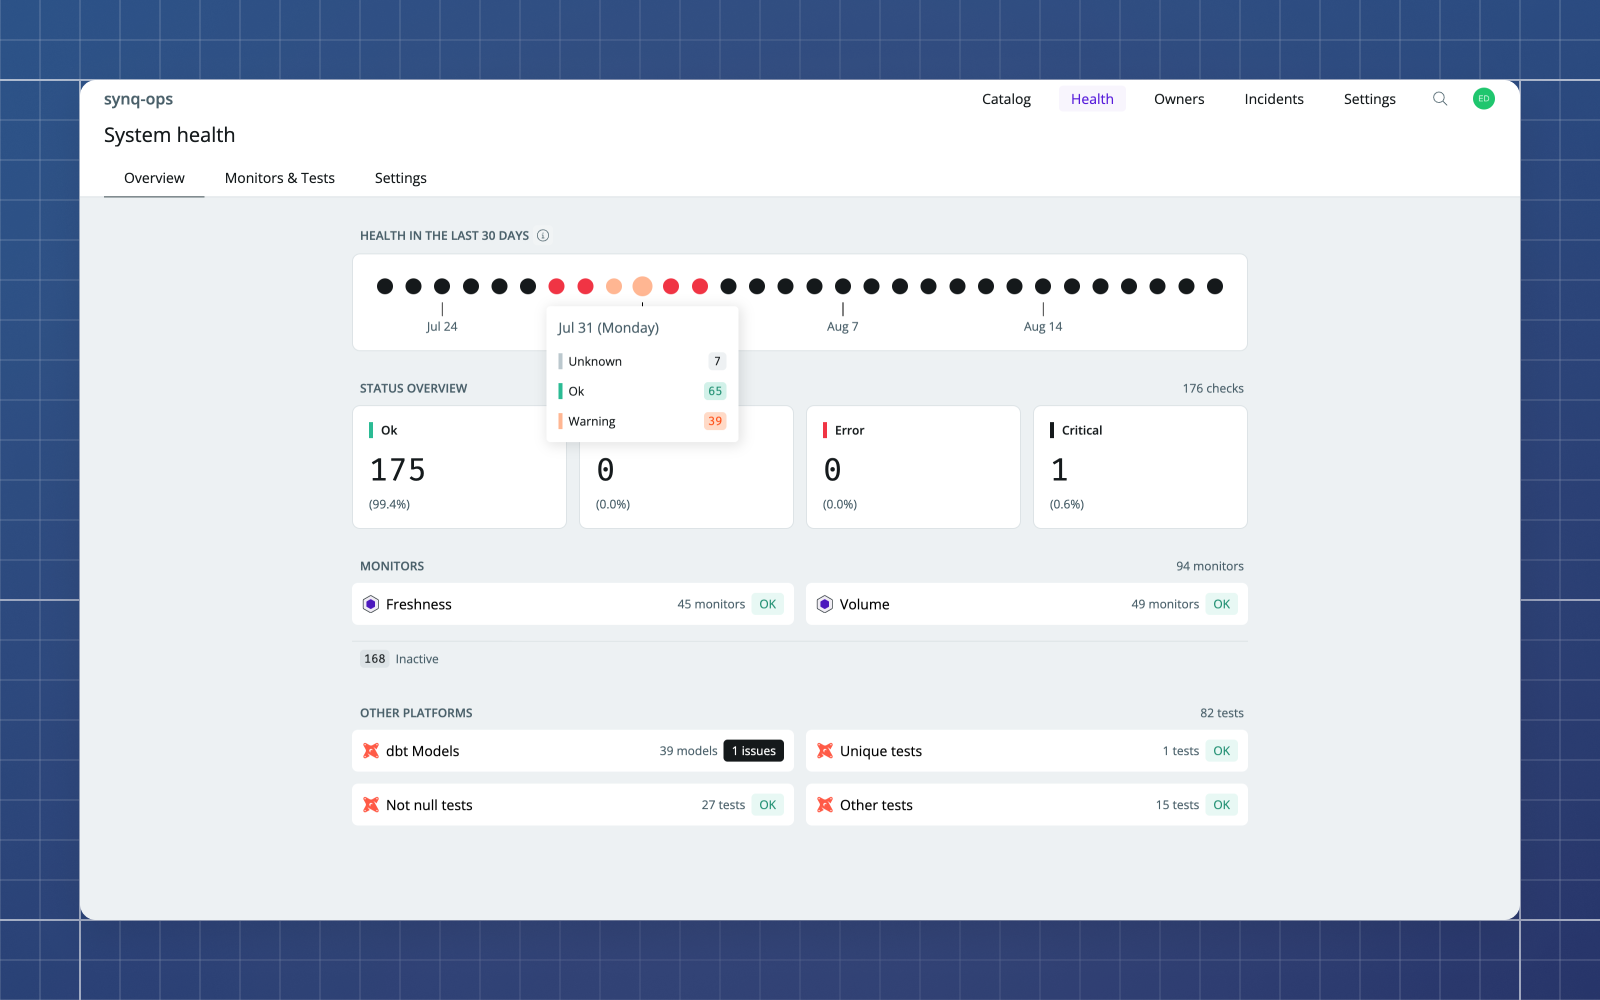
System health & more accurate anomaly models
New health overview at the system and asset levels supported by more powerful anomaly detection models.
A faster review monitors and tests
We made reviewing dozens of tests and monitors faster and from a single screen.

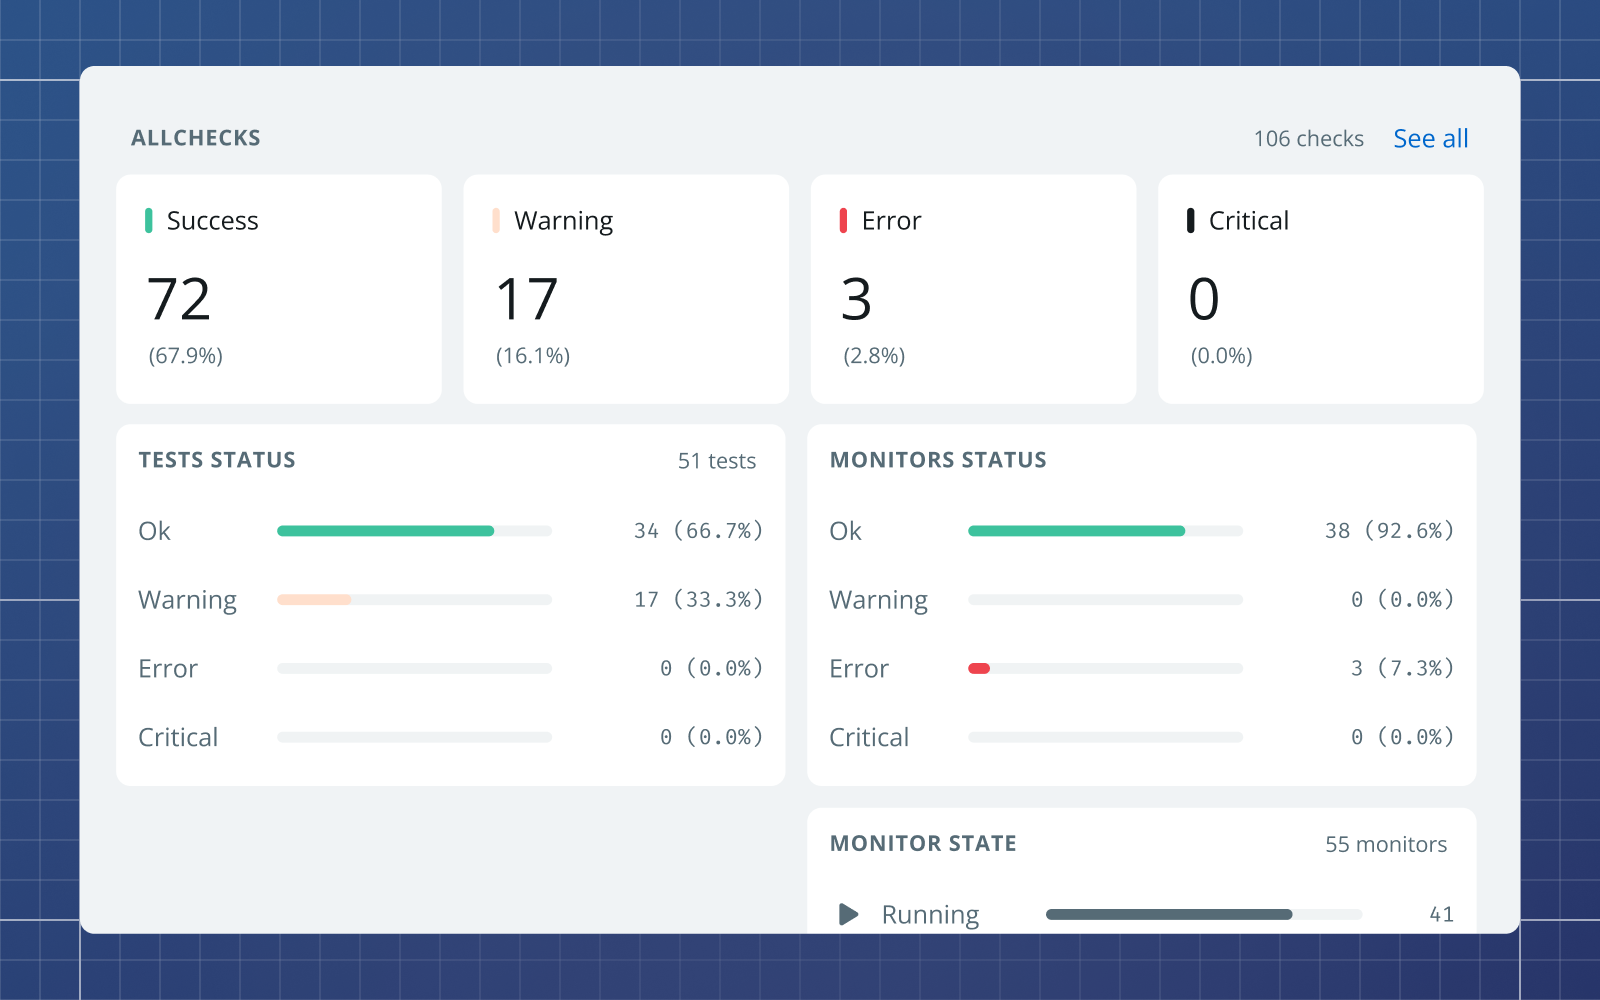
An overview of the status of your stack
See the status of all dbt checks and Synq monitors in one place.
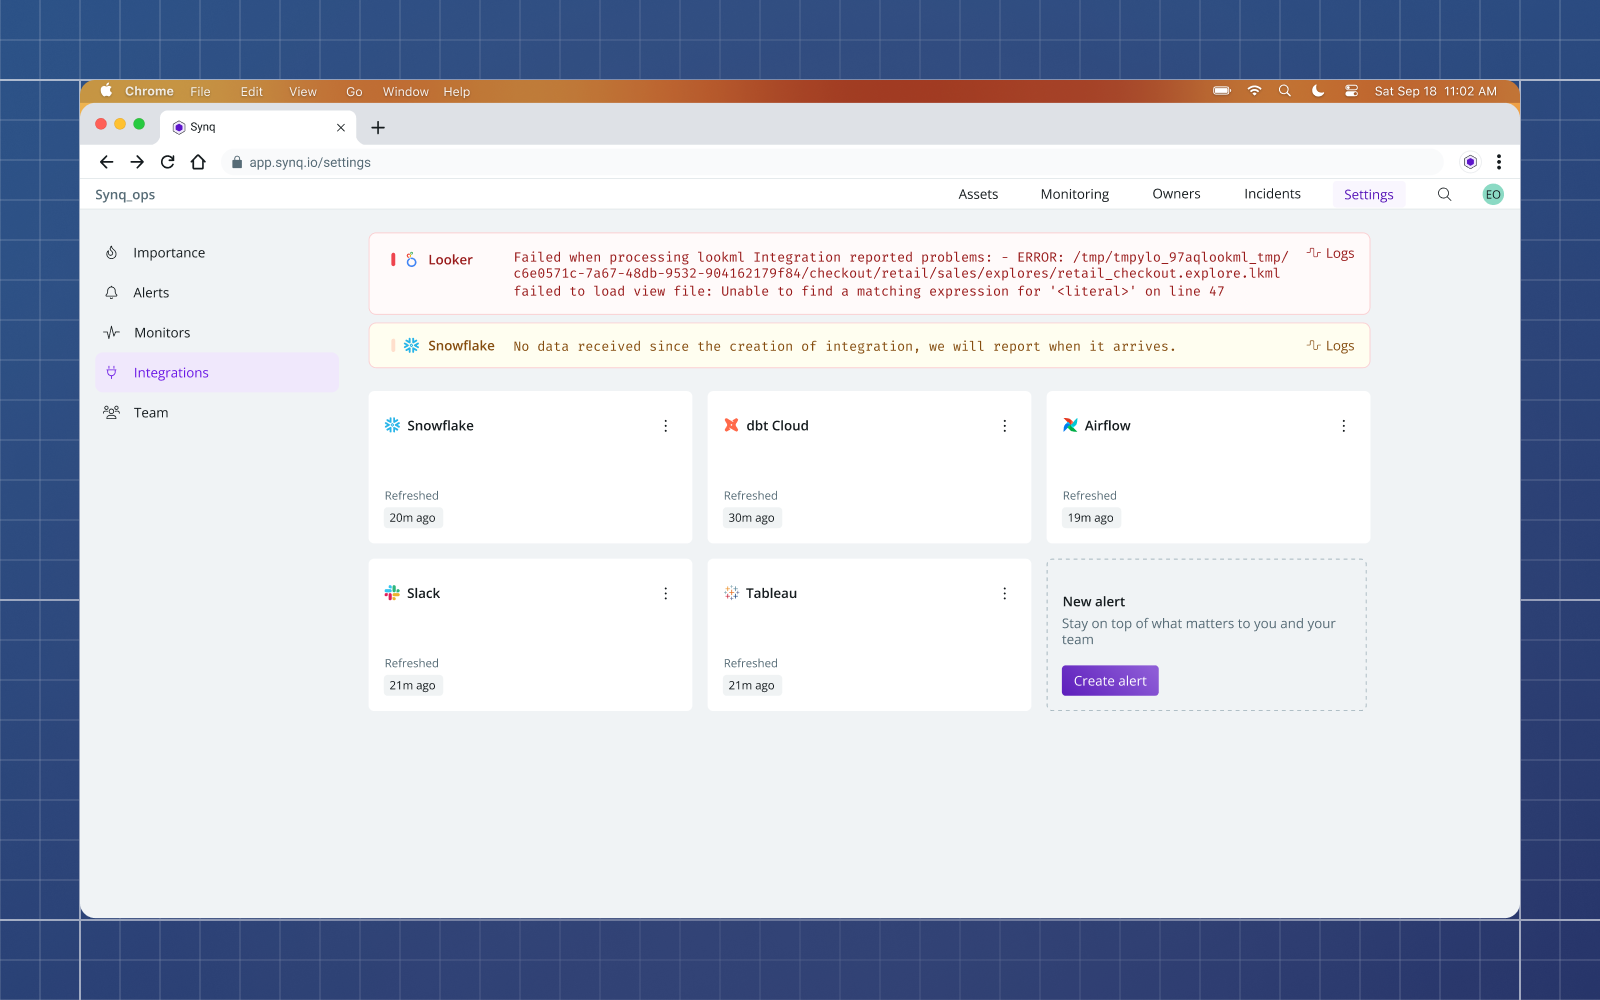
Better integration errors
Issues with your integrations now provide information about the error to help you understand the problem.
Brand new lineage
We rebuilt our entire lineage specifically for large workspaces and introduced many usability improvements.

Access monitors from anywhere
Faster filters, relationship tests visibility and monitors get their own space.
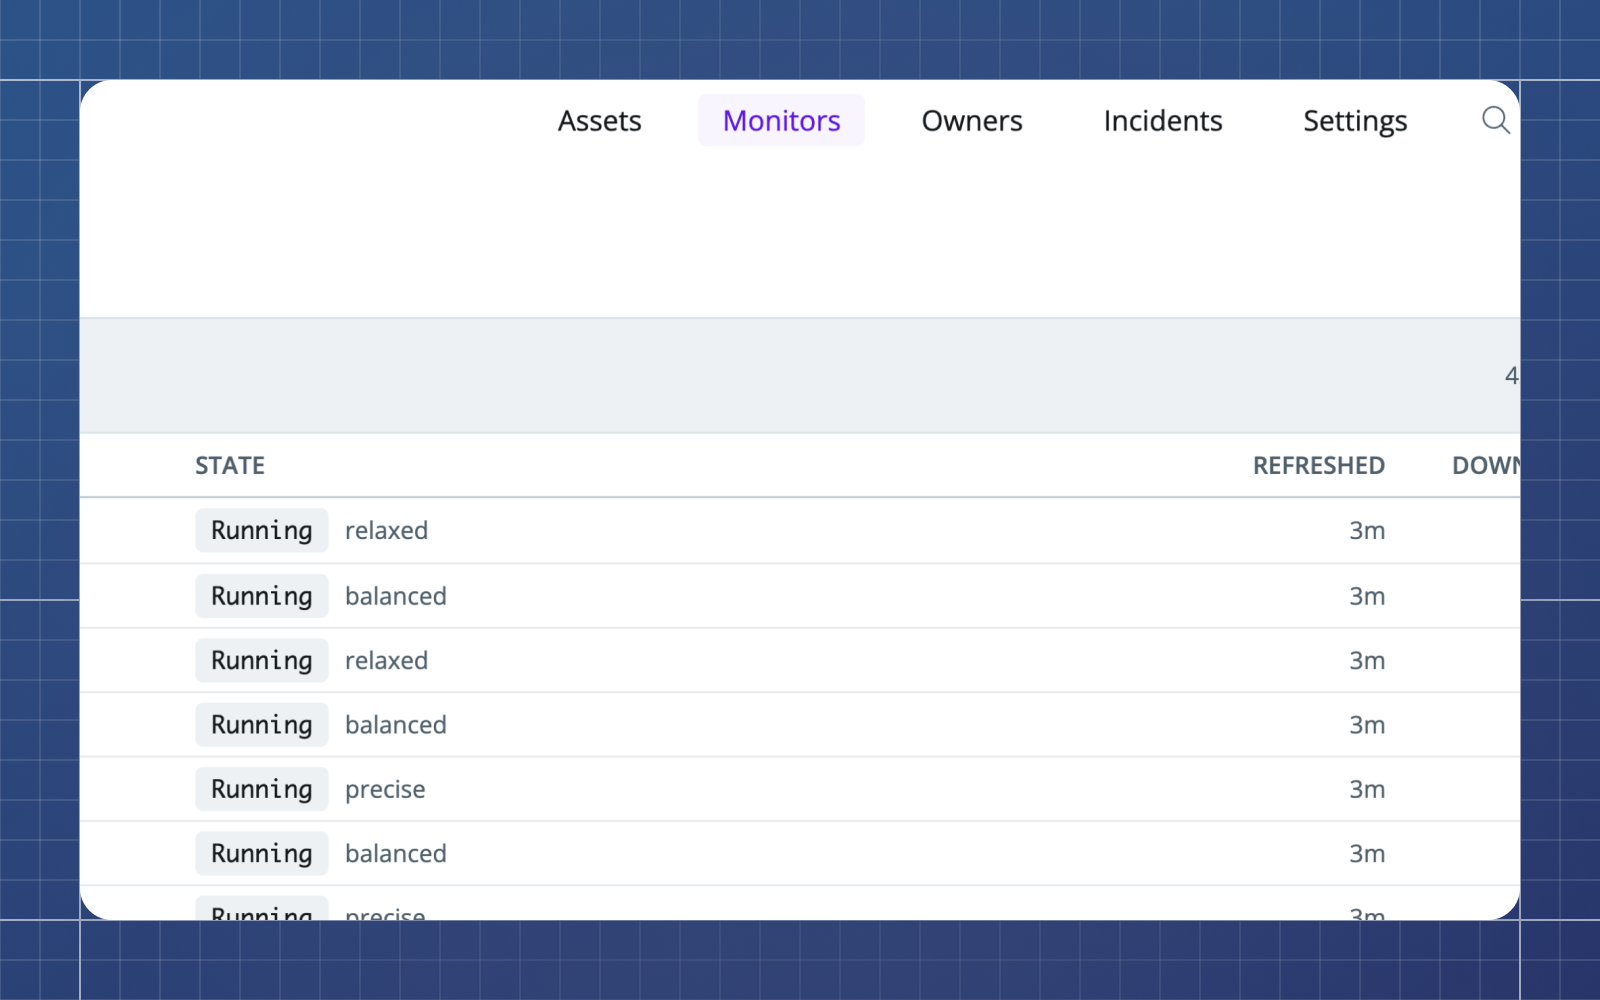
Monitors and UI updates
Monitor sensitivity, statuses, and UI improvements.

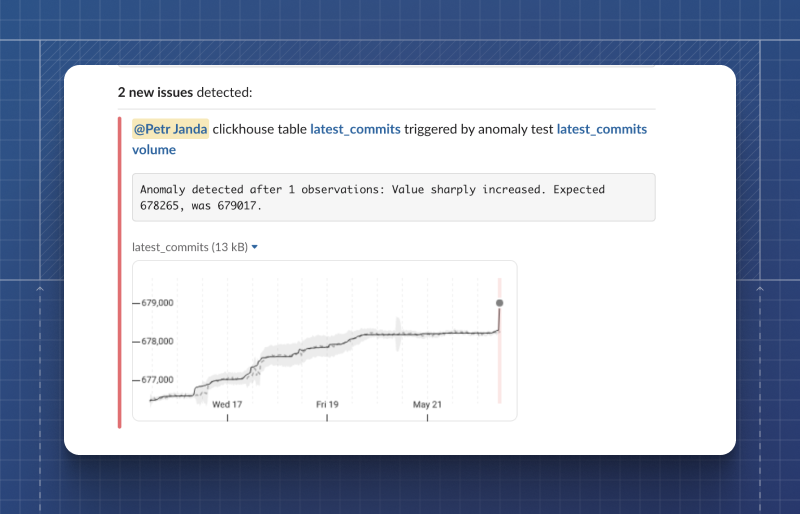
Anomaly previews in Slack and model feedback
Preview of anomaly alert in Slack, model feedback.
Assets overview and new filters
Browse all assets, and filter incremental tables or issues from yesterday.

More precise Slack alerts
Alert confirmation, preventing typos and more granular severity configuration.
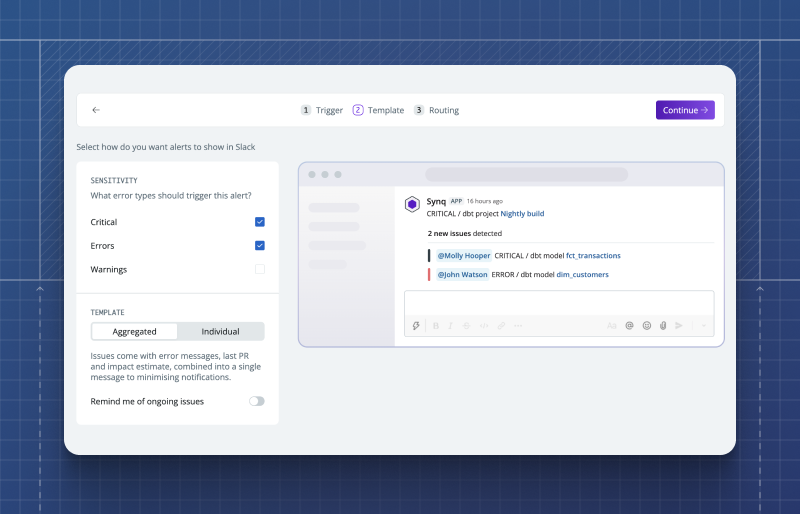
Unified error detection with dbt tests and anomaly monitors
Combine dbt tests and anomaly monitors into one error detection strategy.
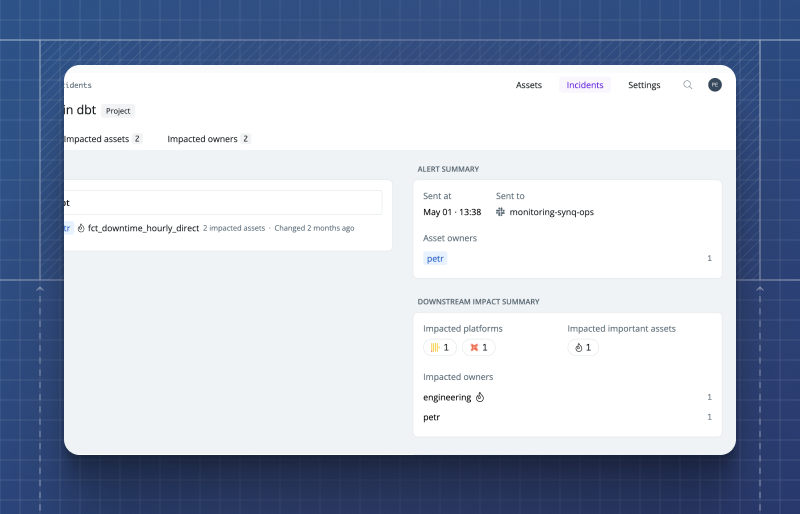
Manage incidents in one workflow
Assess the impact, analyse root cause and manage incidents effectively.
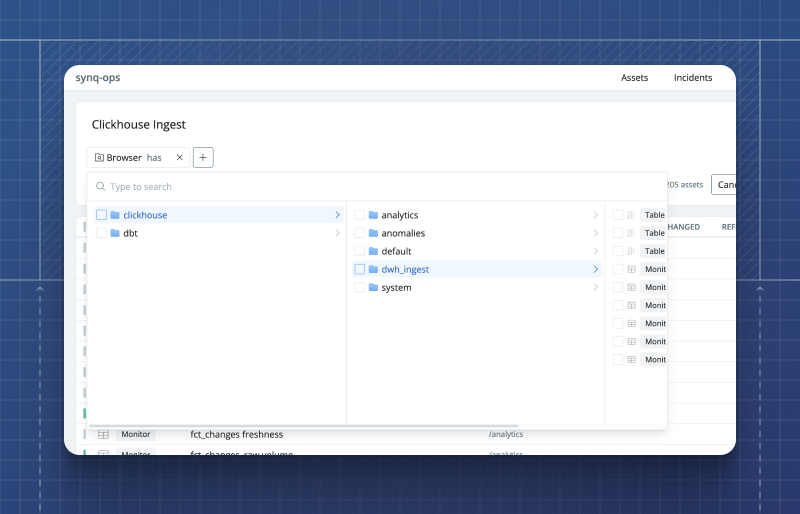
Navigate your entire stack with ease
Browse your data assets across dbt, BI tools or data warehouse
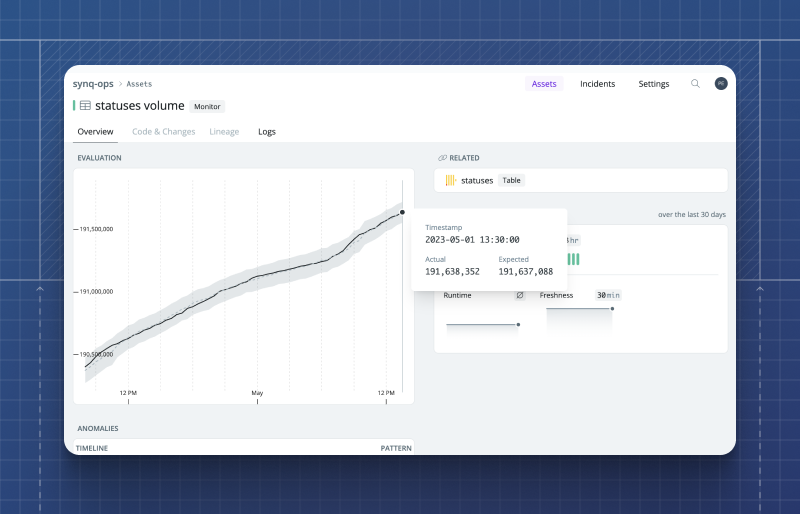
Analytics for Data Practitioners
Aka data about metadata, for purple people.
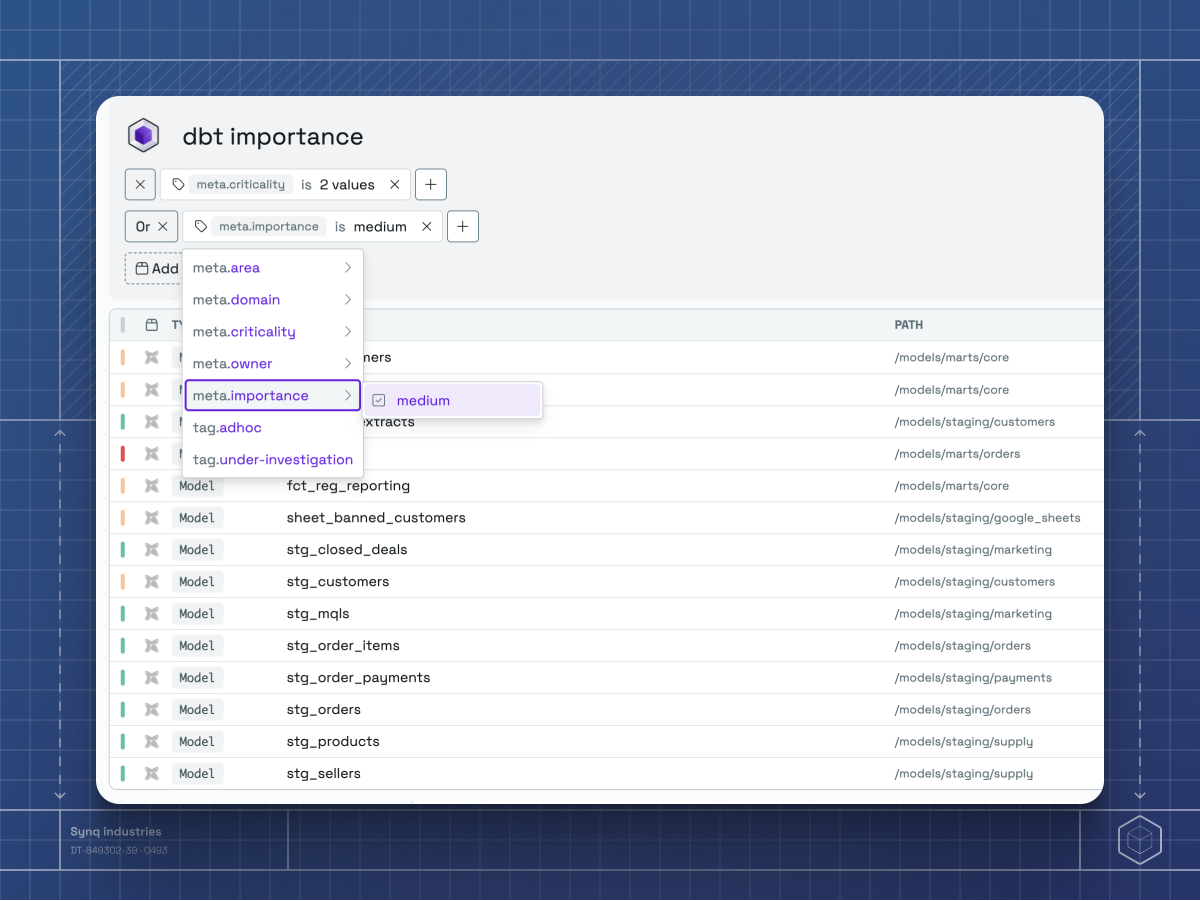
More powerful filters for more ambitious use cases
Filter groups, email alerts, improved table tests.
dbt to Looker impact assessment in two clicks
Synq experience now works across data transformations and BI.

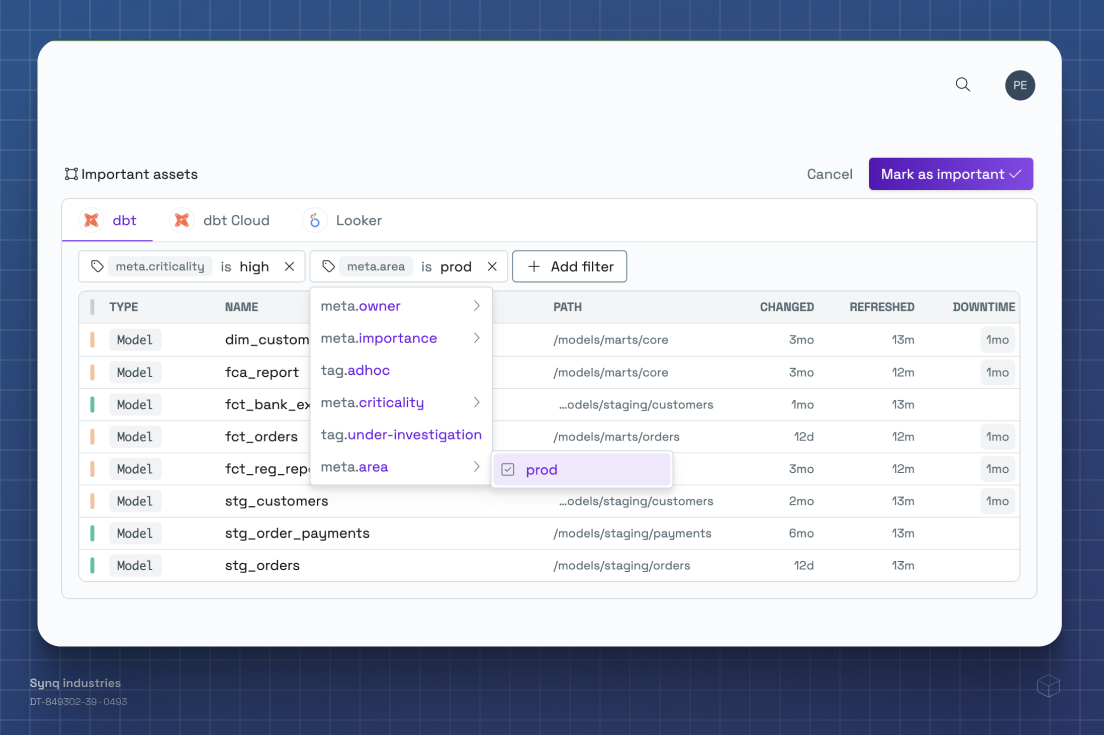
Make the most important data stand out
Giving teams the tools to manage their most important data assets.
Alerts and Users management
Invite colleagues, set alerts for all assets, owners or custom groups.

Build with data you can depend on
Join the data teams delivering business-critical impact with SYNQ.
