Unification of models and tables statuses
See the status of associated assets in Overview, better Tableau integration, and more.
Improvements to Monitor setup
This week, we focused extra on ensuring that your monitors are visible as soon as possible. When new monitors are created, they are scheduled to fetch the data from the data warehouse. Previously, we would start showing them only after that initialization run. Now, they are displayed immediately. Also, when you remove the monitor, it just disappears.
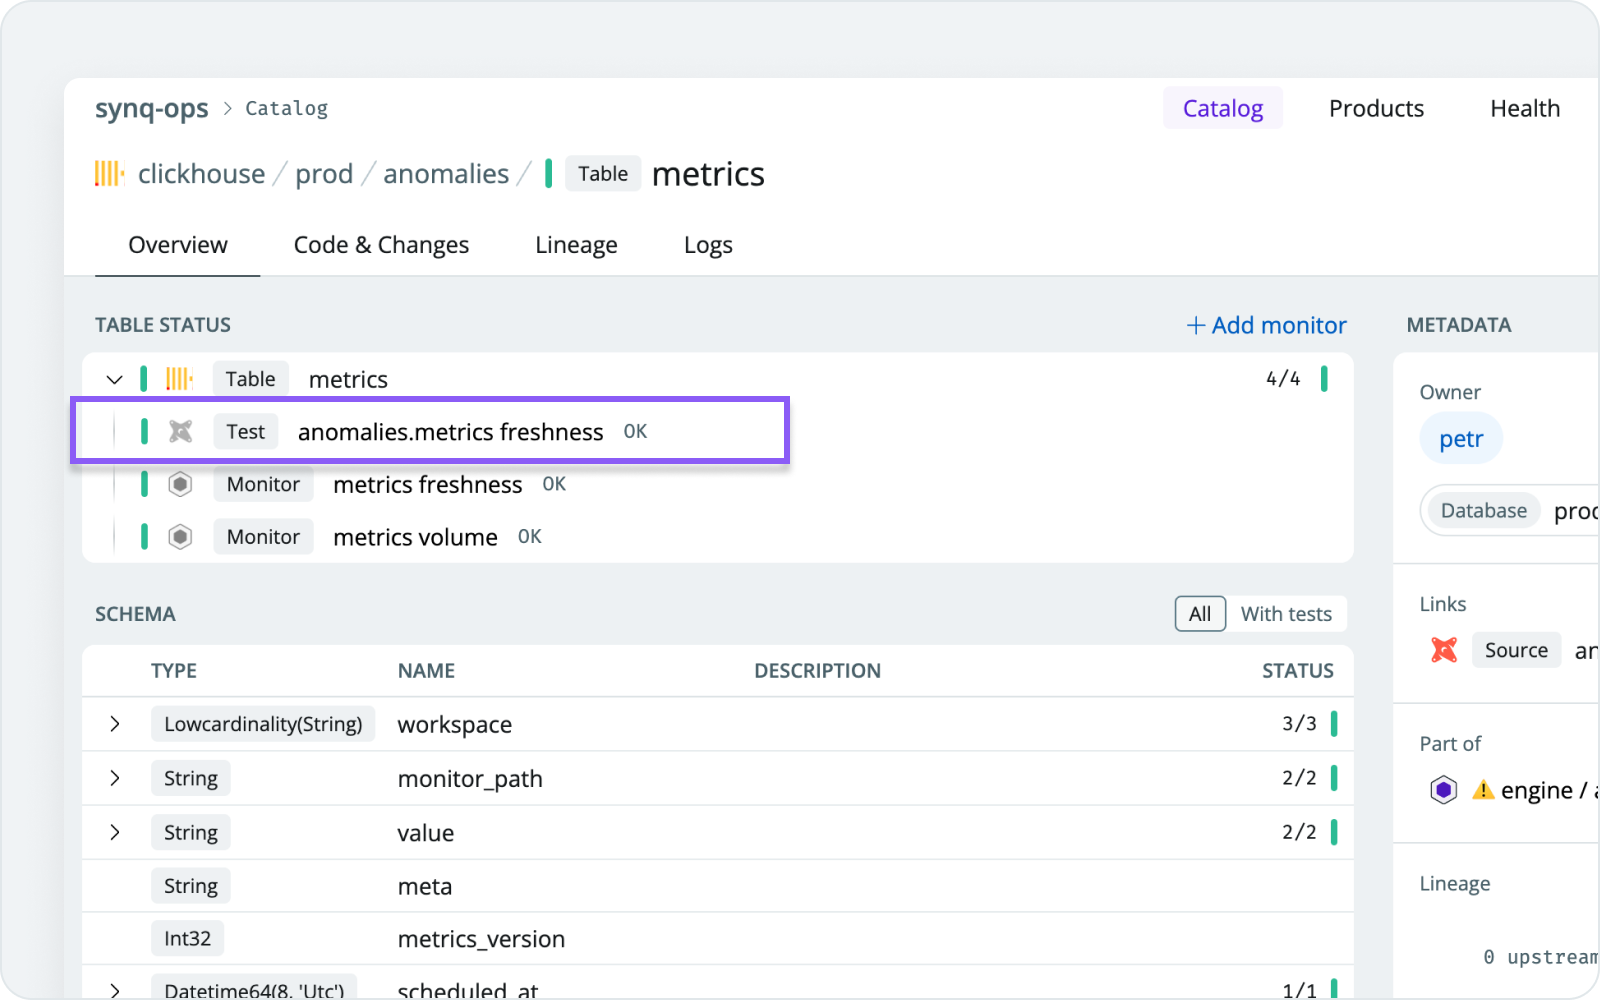
Unification of DHW Table / dbt Model status setup
When there is a clear 1:1 relationship between the table and the dbt model or source, we present all table monitors on the dbt model overview. Similarly, dbt tests running on models are now shown on the tables, which are the result of that model run.

Improvements to Tableau ingestion
Support for very large Tableau workspaces was improved. Tableau server API has strict limits on how many things (and how deep) it can return. We now fetch data from the Tableau server in smaller batches, which helps us retrieve all of the project information even if there are thousands of columns present.
This week, we also ensured that Export freshness import doesn’t run in parallel to Tableau metadata queries, as that could have caused non-complete metadata imports due to Tableau API limitations.

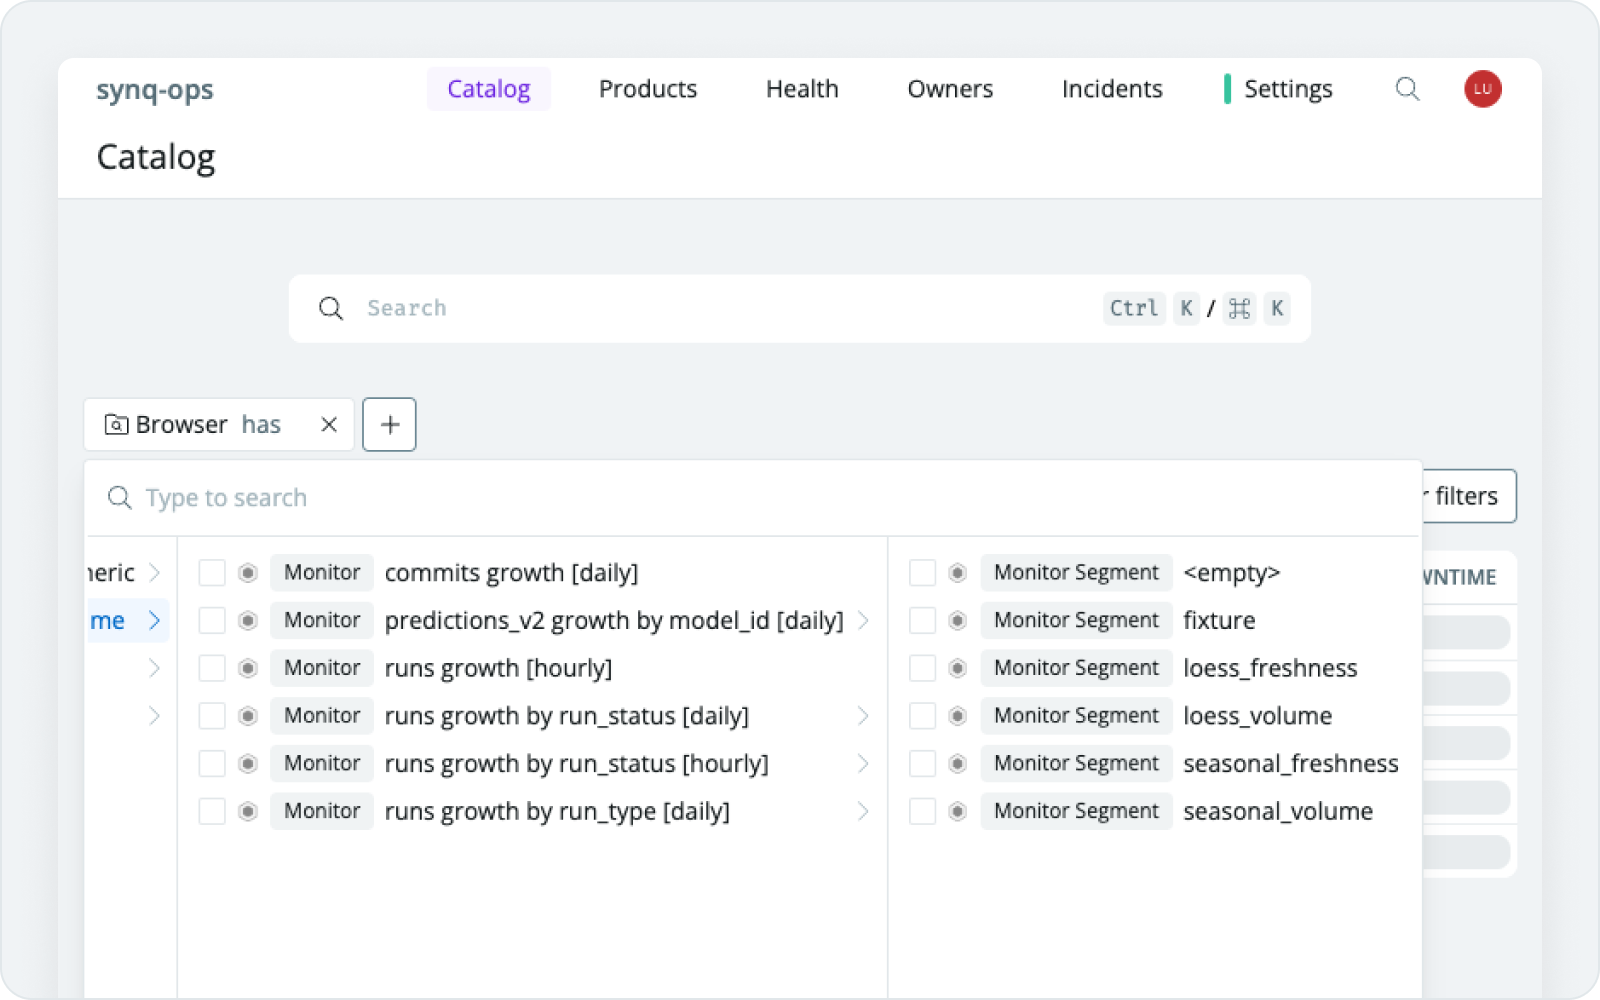
Monitors browser
Last but not least, our monitors are now easier to find in the Catalog browser. They are organized around types. We also added support for selecting specific monitor segments, allowing for improved monitor alert routing.


Build with data you can depend on
Join the data teams delivering business-critical impact with SYNQ.
