System health & more accurate anomaly models
New health overview at the system and asset levels supported by more powerful anomaly detection models.
Granular insights in System Health Overview
Understand the health of your system at a granular level with the new system health overview.
The new timeline component helps you understand how the health of your data evolves over time.

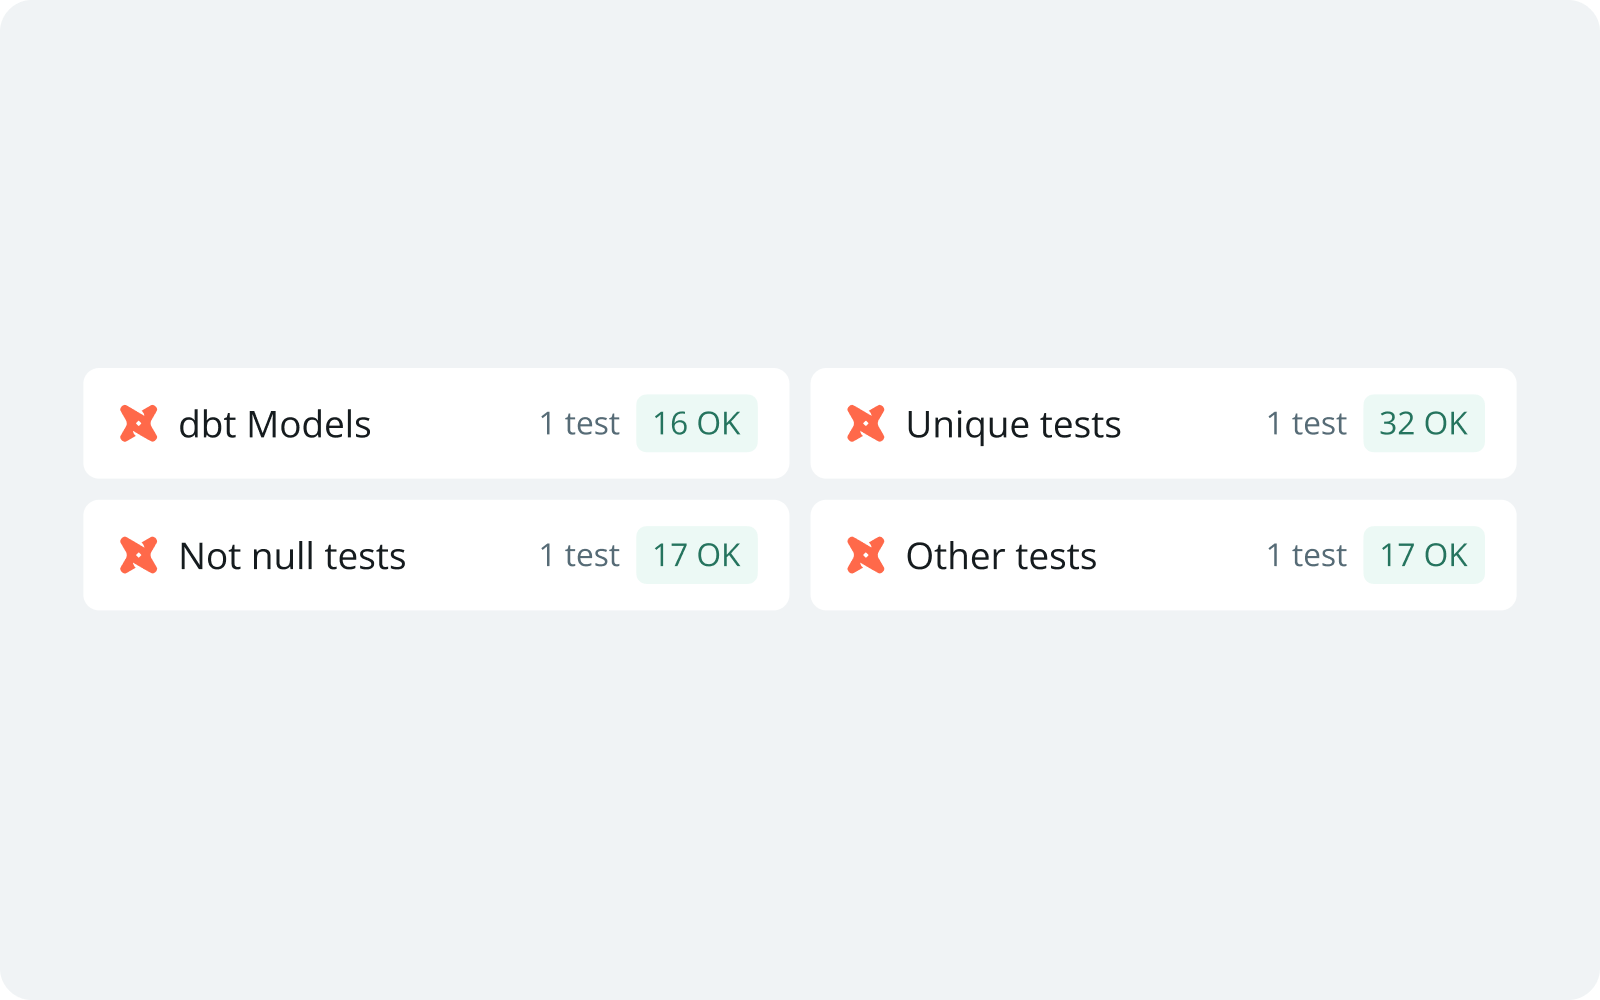
The overview now centers around monitor and test types to give you an instant understanding of what types of errors are in your system.
Leading with Synq automated (and soon opt-in monitors), it indicates the state of various dbt tests on a granular level.
Health on Home and Asset Overview
The new health widget is also placed on the home screen and displays the number of errors, warnings, or critical issues. This gives you an instant understanding of the state of your system every time you log into Synq.

We overhauled the asset downtime overview to provide maximum consistency around how we display health across Synq.

Improved anomaly detection model
Having built our core anomaly engine to fast detection —down to data changes in 5-minute intervals— we now improved the model’s behavior for the opposite case: when data reloads once a day or less. Our model dynamically detects the frequency of updates and automatically reconfigures to provide the best recall and precision.
Improvements & bugfixes
- We introduced a dbt Test type filter, allowing you to create lists of assets of dbt test types.
- We fixed a bug that was causing the last data point in our anomaly charts to be cut out.
Build with data you can depend on
Join the data teams delivering business-critical impact with SYNQ.