A faster review monitors and tests
We made reviewing dozens of tests and monitors faster and from a single screen.
These panels make looking at multiple health checks much faster while keeping you in the context of the list.
Quickly adjust monitor sensitivity
When you click on a monitor, you’ll immediately get a sense of what the anomaly was. You can also tailor the model’s sensitivity to your preference.

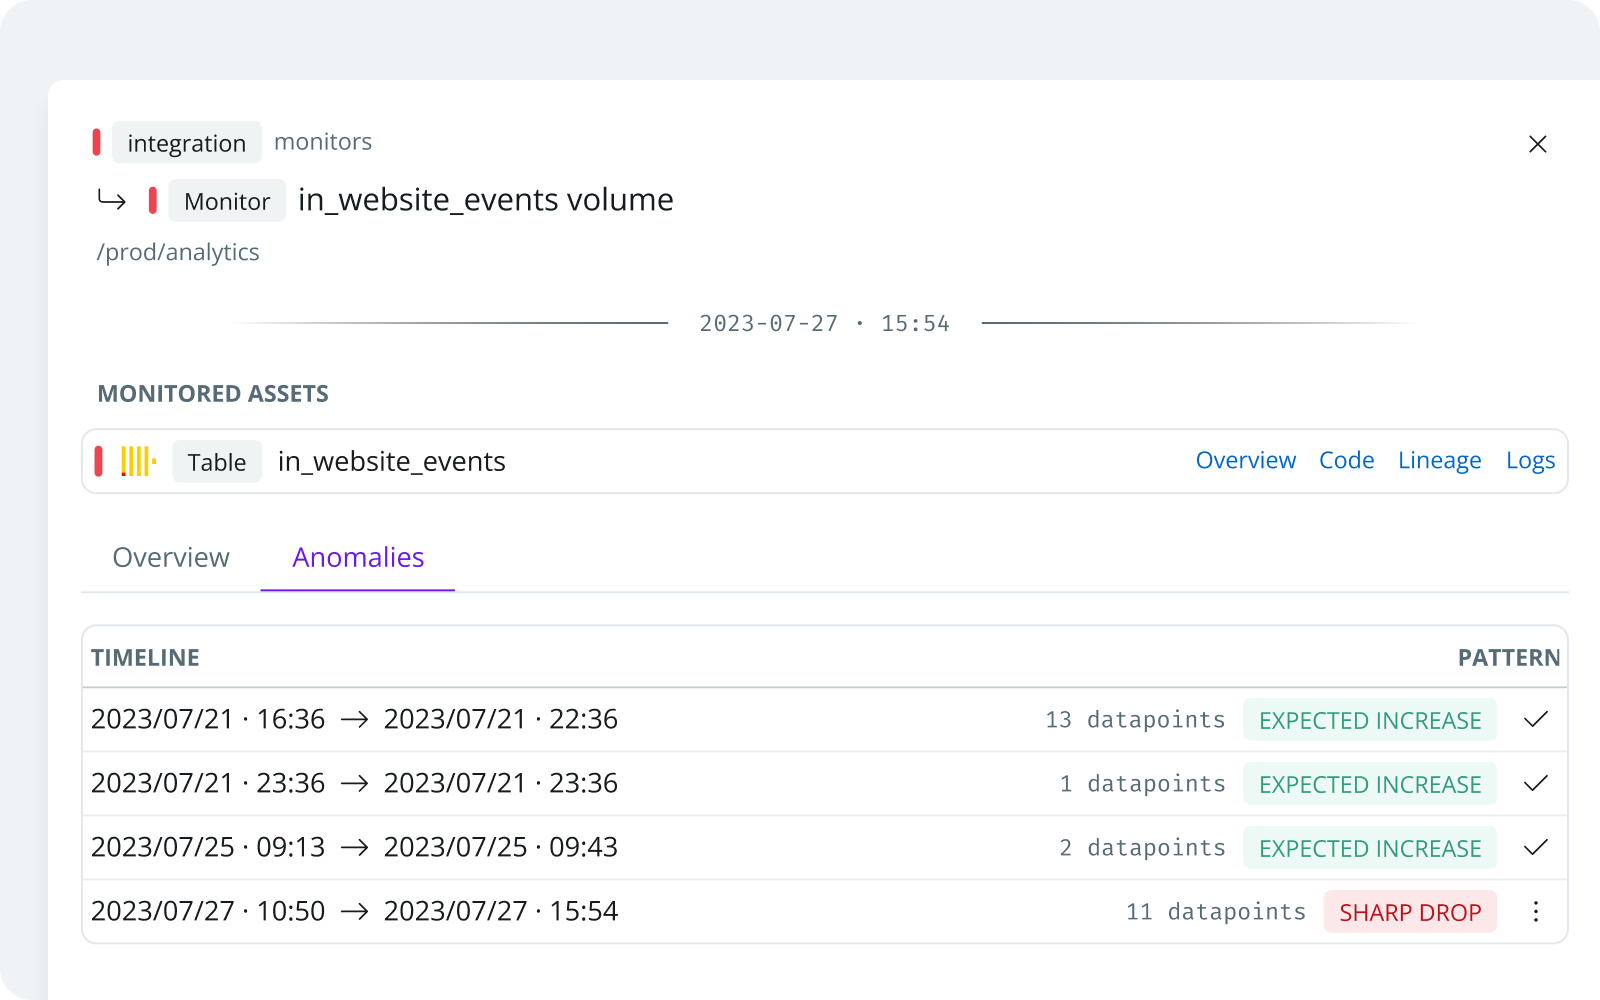
List of all anomalies
On the second tab of the monitor panel, you can see a list of all the anomalies to understand what has happened with the data over time.
Here you can provide feedback on each one to help the algorithm improve the accuracy of its expected ranges.
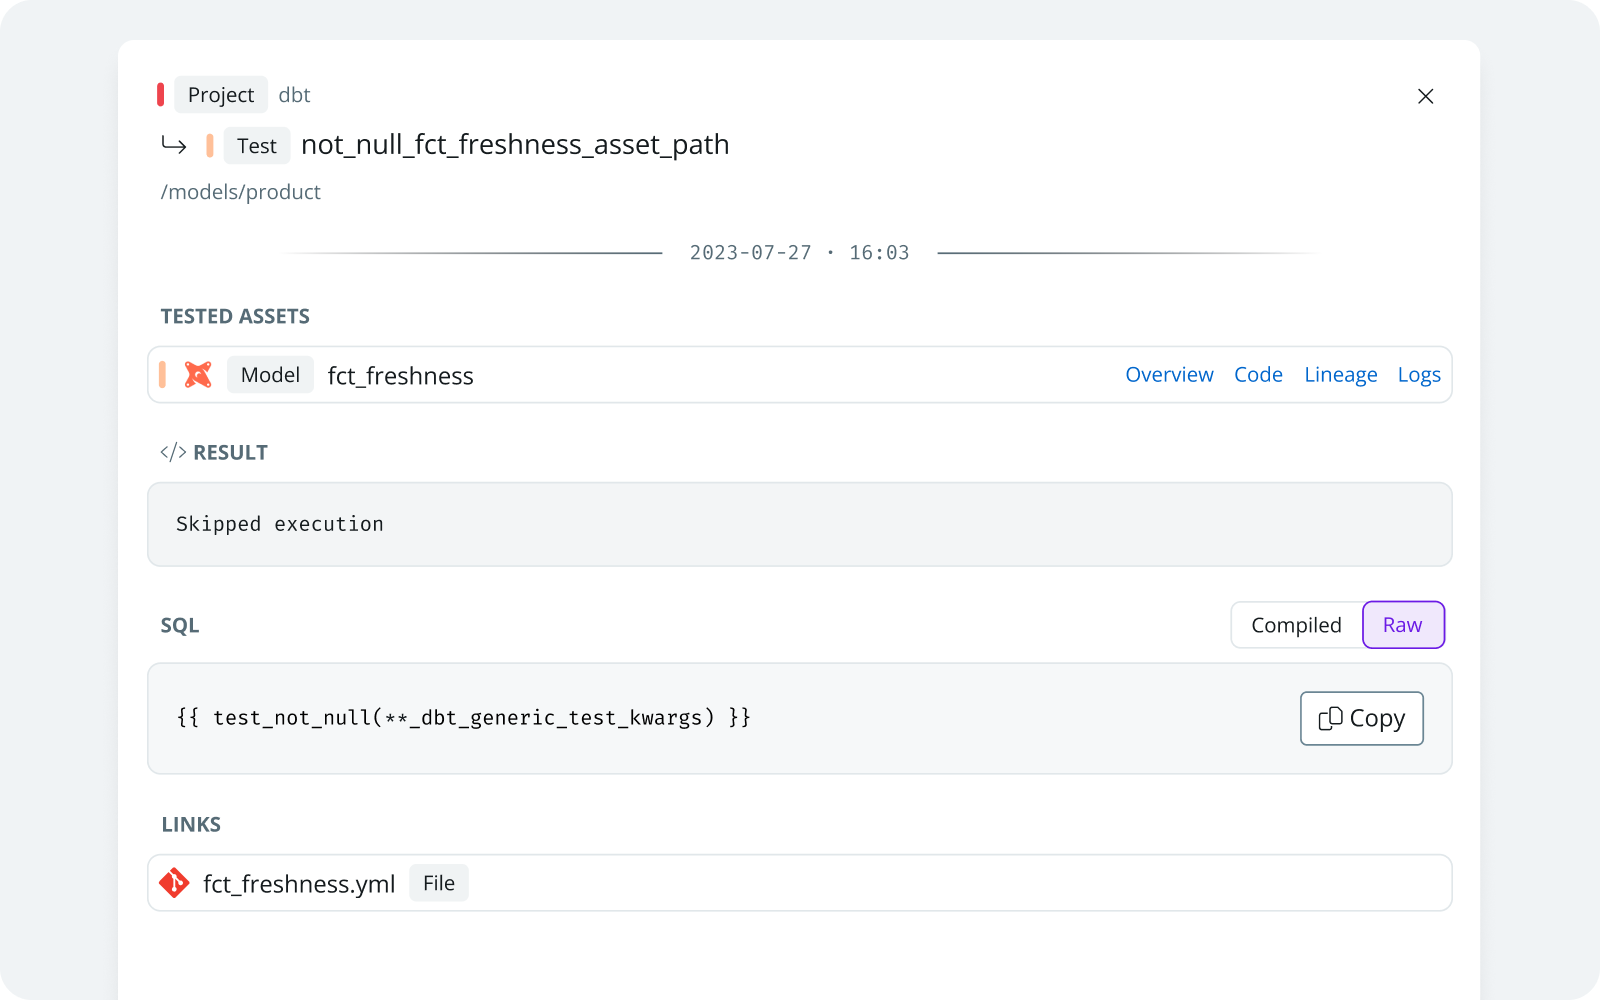
Test side panel
You can quickly understand the error on the test panels by looking at the result. You can also look at the code to understand what the test is checking for.
Last but not least, there are shortcuts to see the error’s impact on the tested asset’s lineage and other helpful information for debugging.
Build with data you can depend on
Join the data teams delivering business-critical impact with SYNQ.