Data alerts are hard

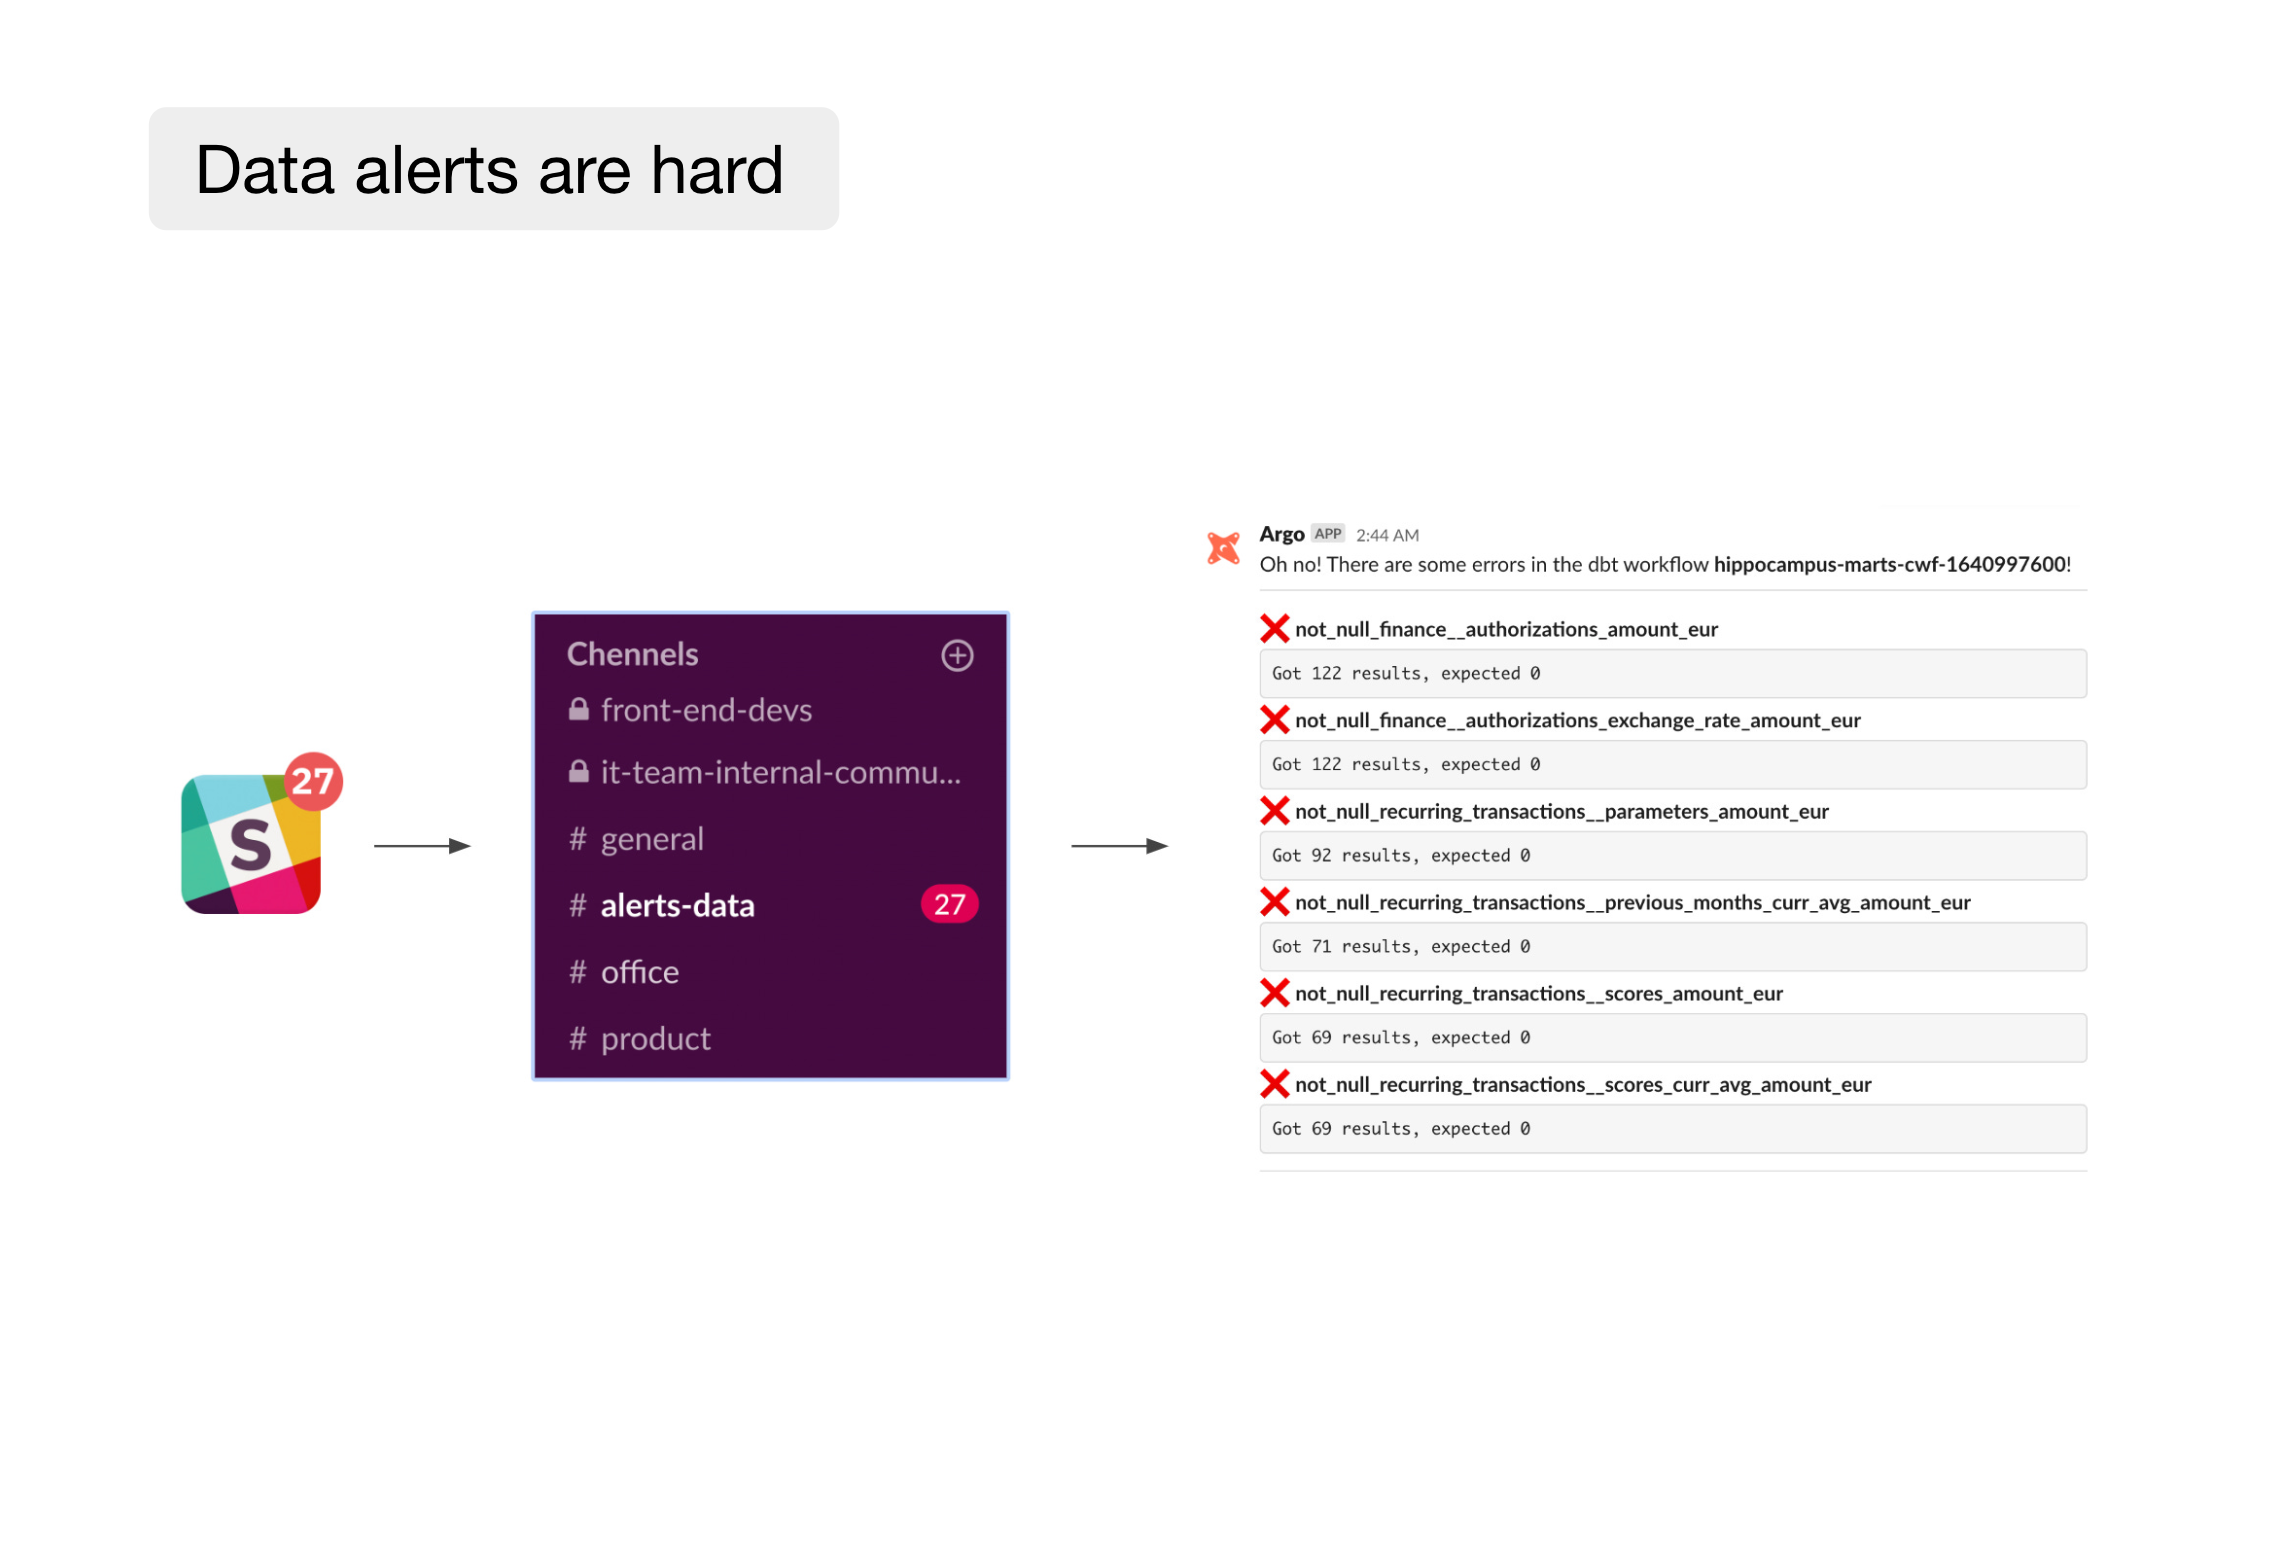
Managing the error alerting workflow in larger data teams is a struggle. It is often up to the data team to fill this gap by developing internal tools and workflows.
What’s the problem?
Data teams at scaleups we’ve investigated average 20 alerts each day. Managing this is no easy task and has several negative outcomes
- Important issues get overlooked
- Triaging and monitoring alerts become a time sink
- The data team loses confidence in the impact of writing tests
The cruciating experience of a Friday afternoon message from an exec due to a missed data alert

In this article we’ll explore
- The distribution and challenges of data alerts for 12 scaleups
- An example of a better alerting setup
- Steps you can take to improve your alerting workflow
A deep dive into data alerts for 12 scaleups
We’ve explored the number of data alerts over a 10 day period for 12 scaleups to get a sense of what a typical day looks like and the challenges they face. We’ve only looked at alerts from data modelling issues originating from dbt running on the warehouse.
The average number of alerts for the data teams in our sample range from just a few to dozens which calls for widely different approaches.

Teams with just a few alerts tend to address new issues as they come up whereas those with dozens of failures each day often have started to accept that addressing all issues is not possible.
“I find Slack really noisy and don’t know which alerts do pay attention to”
“If there’s an issue with a cluster we may have a bunch of models fail at the same time and it’s really noisy to pick out what’s important”
Alerting workflows break with scale
We’ve picked two examples and looked into alerts for a 10 day period. Example 1 is a six person data team with a few hundred data models. Example 2 is a 40 person data team with thousands of data models.
Example 1: Six person data team
The team gets a few alerts per day and addresses most of them immediately. Responsibilities are clearly defined and little time is spent on this type of work.

A simple workflow is sufficient to stay on top of data errors
- There’s a data floater duty with someone assigned to look after issues each week
- The stack is still small enough that most people know how to fix everything
- If an issue can’t be fixed by the floater, they always know who to escalate to
- It’s easy to understand if a problem is critical and there are a only few dozen downstream dependencies
Example 2: 40 person data team
The large data team receives an order of magnitude more alerts on some days. On Thursday January 12th, the team had 31 new issues and a few analytics engineers had to drop everything to fix a critical model failure.

A simple workflow is no longer sufficient to stay on top of data errors
- It’s no longer clear who should look at each issue
- There’s no clarity of which issues are important
- Downstream teams are blocked by upstream issues but don’t know who to go to
A better solution
Below is an example of how the data team at Monzo, a UK fintech unicorn, has tackled the alerting workflow to better fit a scale with more than a hundred data people and thousands of data models.
The alerts bring together importance, ownership, root cause, debugging and workflows all in one place.
Katie Hindson from Lightdash who’s a former Monzonaut has thoughtfully described this setup on the Locally Optimistic Slack community. Here’s a summary.
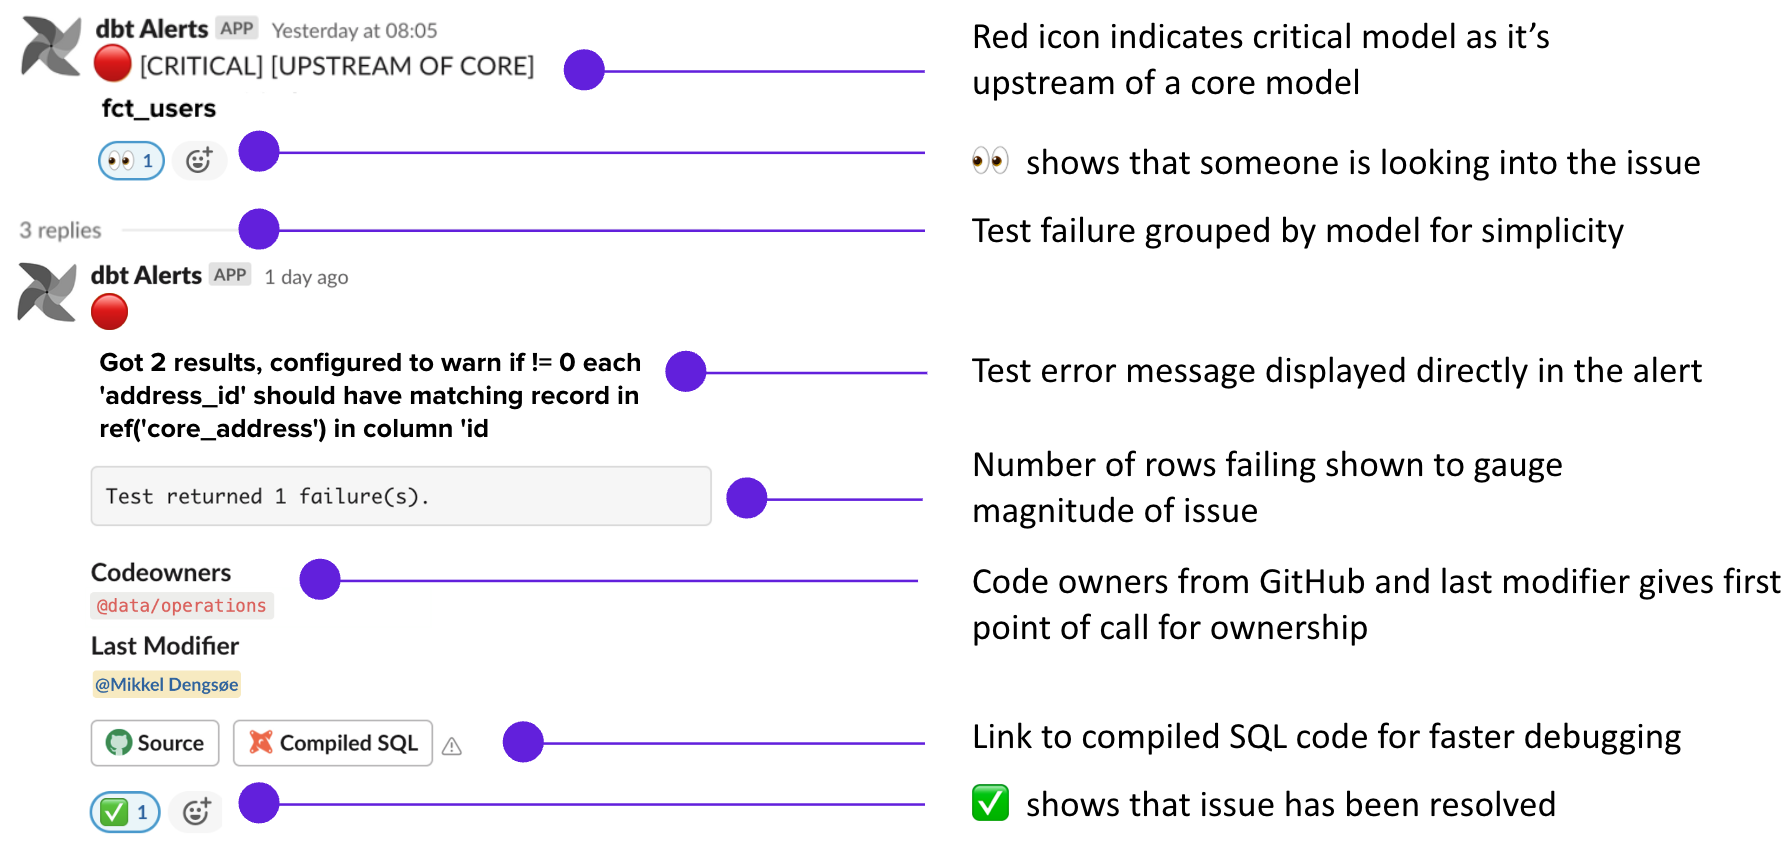
You can define how critical test and model failures are in the dbt yml file
- Any models with the tag critical in dbt appears with a red circle
- Any models with no critical tag is, by default, labelled to be warnings with a yellow circle
The setup allows for error management workflows fit for scale
- Each test is a separate message in the #data-monitoring channel but grouped by model. This way you can reply in the 🧵 for each failure, mark them as fixed ✅, etc.
The test failure messages show some extra, relevant information
- For each test failure, it tells you which model was failing and what the test error is
- You can click on Compiled SQL to open the compiled code for the failed test directly in the BigQuery console which makes debugging easier
The last person who edited the file is tagged in the error message
- If you were the last person to edit fct_users, for example, and it failed, then you would be tagged in the slack message.
- The code owner group from GitHub is displayed in the error message
The team also has a Slackbot that reminds the channel every day at ~ 9AM “Have all of the critical models completed?“. The critical models should have been completed by 9AM, so if they haven’t yet, then the team knows something is wrong.

The data floater is responsible for dealing with the data monitoring each week
- If you are the data floater, you are responsible for handling the data monitoring. That means: asking for help when needed, giving status updates on critical test failures to the rest of the company
- The data floater is responsible for checking that Slackbot reminder from above
What’s an analytics engineer to do?
We’ve been working with several data teams and when you apply some of the learnings to the large data team in the example above, things begin to get more manageable.
Make important issues stand out
Let’s return to our example from above with the 40 person data team. When they only look at critical model-level errors that broke the core pipeline, the situation is more manageable. Although you should still have the ambition to address all test issues, this gives you the right tools to prioritise.

Minor test errors on unimportant models can be postponed for later and critical blocking model failures or tests errors on critical data are easier to identify.
Have workflows for known issues
In the sample we analysed for the larger company, over a 10 day period more than 60% of issues were recurring issues. That is, the same alert being flagged several times. 30% of the issues were persistent throughout the entire period meaning that the team sees the same Slack alert at every run.
It can help having a clear way of separating your ongoing issues, especially if you’re running tests multiple times a day.
For example
- Temporarily assign these issues to warn-level severity
- Introduce a tag in dbt for known issues and run them on a less frequent schedule
- Split new and ongoing issues in your alerts
Activate ownership in your alerts
While a stream of dozen alerts may seem unmanageable, if they’re broken down by the relevant owner they become more manageable and accountabilities are clear.

The chart above shows the errors when grouped by the owner of the model where the issue occurred. This makes the actions the team could take more actionable
12/01: There was an incident with the core users table which also impacted downstream marketing data models. This is important for the analytics engineering team to fix quickly
15/01: There was an issue with the core inventory data owned by the analytics engineering team
16/01: There’s an issue with unassigned models in the loan domain. A good time to assign them owners
22/01: There was an issue on the customer activity data model. This should be assigned to the analysts in the Customer team
Have an issue resolution workflow for your alerts
Implement workflows directly in Slack that makes accountability, actions and next steps clear. For example
- 🧵 discuss issue in thread so the relevant information is there alongside the model or test error
- 👀 issue is being looked at to avoid multiple people looking into it at the same time
- ✅ issue has been resolved and the data is good to use
Make the debugging information readily available
Not everyone finds the same joy in trawling through Airflow logs to dig out potential test errors or search around dbt to get to the compiled code. Make this data easily accessible so you empower everyone to be able to solve issues themselves.
The missing control centre
As the data stack grows, so does the number of things that can go wrong and the alerts you may have to monitor. In the examples above we’ve just focused on issues at the warehouse and data modelling layer but in reality it’s often more difficult. Even with a relatively simple stack consistent of BigQuery, Tableau, dbt cloud and Fivetran you’ll have to keep an eye on multiple places to stay on top of data issues with alerts arriving both in Slack and to different email aliases.

Odds are that the same challenges that you have at the data warehouse layer also applies here. A more complex stack may include separate Airflow jobs for machine learning models, exports from reverse ETL tools such as Hightouch or Census and much more.
An ideal solution could take the same principles as the example we went over for Monzo and apply these to system-wide alerting.
Summary
- Data alerting workflows start to break with larger data teams, often averaging more than 20 alerts in a single day
- Combining criticality, ownership, root cause and issue resolution workflows into the alerts can dramatically improve the experience
- The problem is getting more complicated when alerts from different tools are arriving in various places and in inconsistent formats

.png)
.png)