
The Complete Guide to Data Lineage: Benefits, Tools, and Best Practices
.jpeg)
.png)
Picture your organization’s data like an electrical grid. In the beginning, there’s a single power plant connected directly to a few buildings, simple, predictable, and easy to manage. But as the city grows, new substations, transformers, and distribution lines are added. Suddenly, a blown fuse in one neighborhood can cause blackouts or surges in completely different areas of the grid. Without a wiring diagram, it’s almost impossible to see how one local fault could ripple across the system.
In a data context, a seemingly innocent change (renaming a column or altering a job schedule) can wreak havoc on dashboards, reports, or machine learning models downstream. This is where data lineage steps in. Data lineage is the architectural blueprint of your data ecosystem, it traces every pipeline, transformation, and dependency so that when something leaks or breaks, you can not only find the fault, but know what you need to fix. Lineage provides visibility into how data moves and changes, acting as the nervous system of a modern data organization.
Why Data Lineage Is Critical for Data Teams
For data practitioners, lineage isn’t a luxury, it’s an enabler of reliable, scalable data operations. A good data lineage capability accelerates core workflows and addresses many pain points in growing data stacks. Key benefits include:
- Impact Analysis: Quickly gauge the downstream impact of an upstream issue or change. Lineage reveals which datasets, dashboards, or AI models are affected, so teams know if an incident needs urgent action and which stakeholders to notify.
- Trust and Data Quality: Ensure data quality and trust by knowing where each metric or report originates. Without lineage, it’s hard to fix bad data. Lineage gives context to data quality issues, linking symptoms to root causes.
- Confident Change Management: Understand the full scope before modifying a data model or schema. With lineage, you see all downstream dependencies of a column or table, so you can make changes confidently without unwittingly breaking something critical. It answers, “if we change X, who or what breaks?” in seconds.
- Faster Debugging: When something does break, lineage turns a needle-in-haystack hunt into a guided trace. Teams can trace data errors upstream across pipelines to pinpoint the root cause faster , drastically reducing time-to-resolution for incidents.
- Onboarding and Collaboration: For new team members or cross-functional projects, a visual lineage map is a lifesaver. It shows how everything is connected, from raw sources to BI dashboards, giving newcomers a mental model of the pipeline and helping all teams speak the same data language. This shared visibility breaks down silos between data engineering, analytics, and business teams.
- Regulatory Compliance & Audit: Maintaining an auditable record of where data comes from and how it’s transformed isn’t just good practice, it’s often mandatory. Data lineage provides a transparent record of data’s origins, transformations, and usage, which is essential for compliance with regulations like GDPR or HIPAA and for internal audits.
- Easier Migration & Cleanup: Planning a migration to a new warehouse or trying to deprecate unused assets? Lineage tells you exactly what upstream changes will impact (e.g. if you retire Table A, you’ll see which downstream tables or reports break).
In short, lineage sits at the intersection of trust, governance, and engineering efficiency.. However, not all lineage is created equal.. To reap the benefits, teams are finding they need lineage at multiple levels of granularity and context. Let’s explore the four key levels of data lineage, data product, table, column, and code-level lineage, and how each adds value.
Data Product Lineage: The High-Level, Business Context View
Data product lineage provides a birds-eye view of how data products depend on each other across the organization. A data product is a collection of data assets (tables, models, dashboards, etc.) grouped by a business use case or domain.
Viewing lineage at the data product level abstracts away the low-level noise of individual pipelines and tables, highlighting the business logic flow instead. Instead of wading through hundreds of table-to-table connections, you can see critical upstream-downstream relationships between entire products.
For example, one SYNQ customer, Aiven, was struggling with a spaghetti lineage of 900+ dbt models. By encapsulating those models into a handful of well-defined data products, they could suddenly visualize dependencies in terms of just those products, rather than hundreds of individual tables. They could trace an issue “up the line” to a faulty upstream data product and immediately identify its owner, or see which downstream products (and thus teams or SLAs) would be impacted.
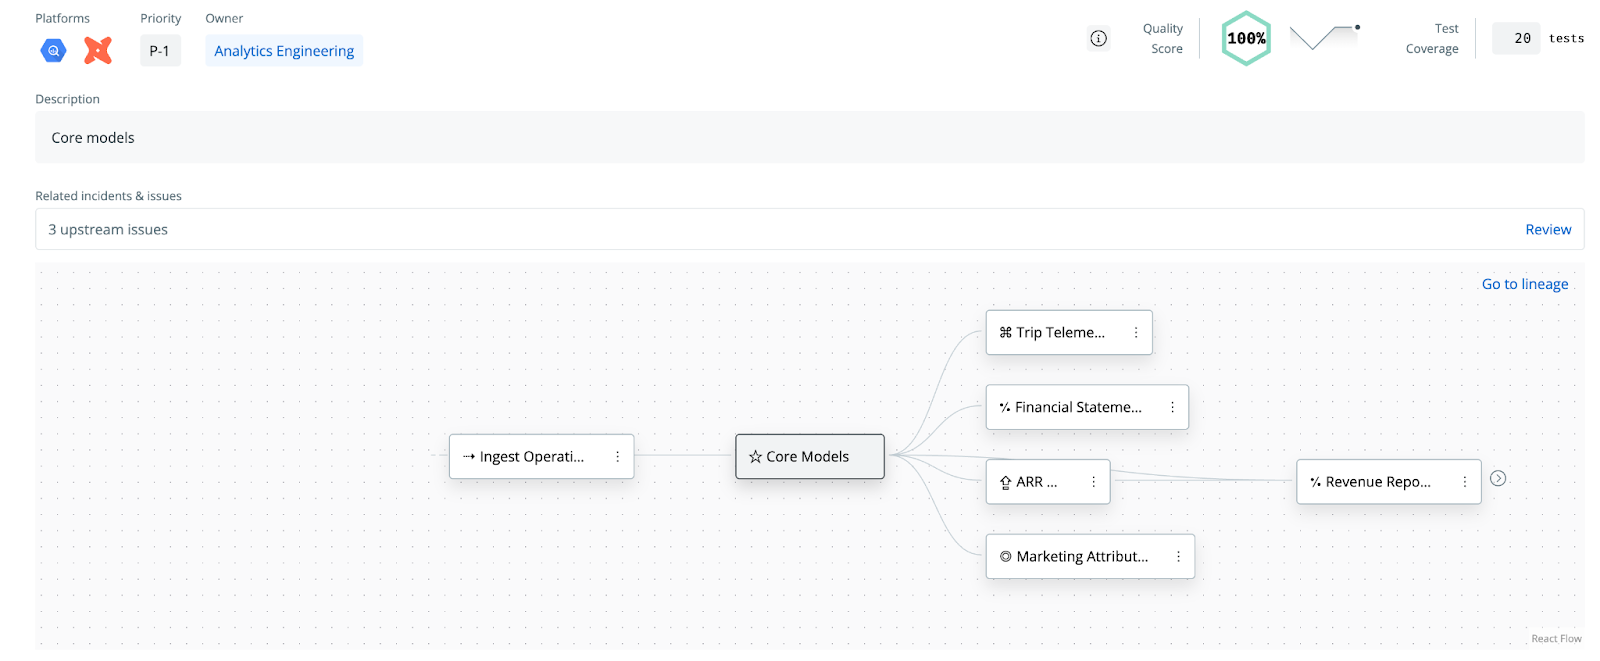
Product lineage is particularly useful for communicating with business stakeholders. It surfaces the contracts between data producers and consumers. Data catalogs and data observability platforms like SYNQ have begun to emphasize this approach as well, offering business-friendly lineage views that show data provenance in terms of products or domains rather than low-level jobs.
By elevating lineage to the product level, data teams get a context-rich view “Marketing Analytics data product feeds into the Sales KPI Dashboard product,” for instance, which is far more intelligible to an organization than “table_a joins with table_b”.
Table-Level Lineage: Mapping Dataset Dependencies
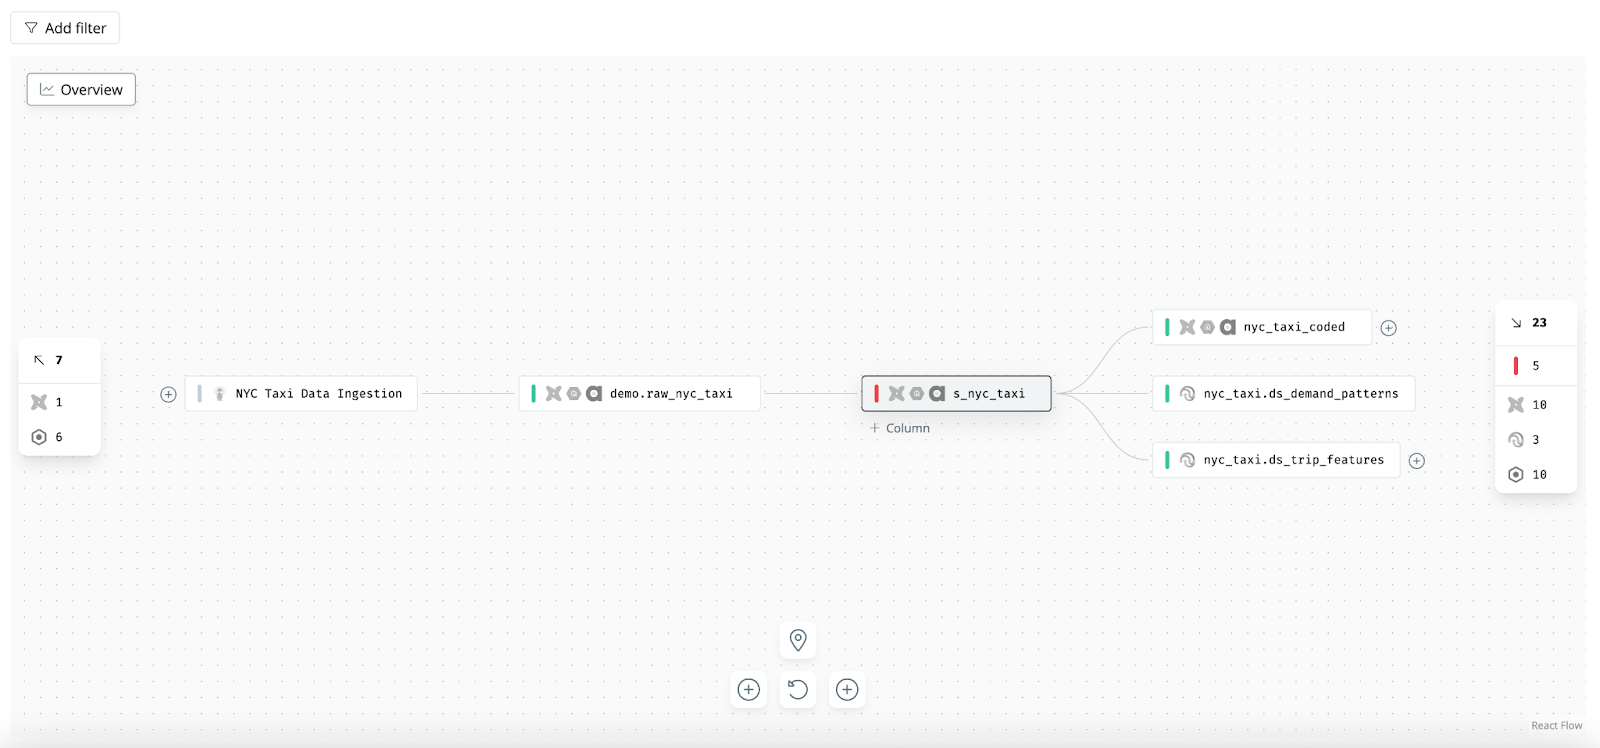
Table-level lineage is the classic view of data lineage: it shows how datasets (tables, views, or data models) are connected by pipelines or SQL transformations. Each node in a table-level lineage graph is a dataset, and each edge indicates that one dataset is used to create another. This is the level of lineage most data engineers are familiar with, often visualized as a directed acyclic graph (DAG) of data jobs or models. For example, a lineage graph might show that the sales_daily_summary table is built from the sales_transactions table and the currency_rates table, which in turn feed into a monthly_finance_report table, and so on.
Table-level lineage is extremely useful for understanding high-level data pipelines and performing broad impact analysis. If a certain table fails or has bad data, table lineage shows all the downstream tables and reports that rely on it. It’s also a natural fit for pipeline tools like ETL/ELT frameworks or data build tools (e.g. Airflow DAGs or dbt model dependency graphs), which inherently operate at the dataset level.
However, table-level lineage has limitations in today’s complex stacks. You might know that Table A influences Table B, but which parts of A matter to B? Which columns or business logic are involved? In a large warehouse with 10,000 tables, table-level maps can also become cluttered hairballs of nodes with dozens of joins and no clear hierarchy.
There’s no notion of importance or context, a critical revenue table and a one-off ad-hoc table all appear as similar nodes. This is why lineage needs to be supplemented with both higher-level views (like product lineage) and deeper granular views (like column lineage).
Despite these drawbacks, table-level lineage is a foundation. It ensures no major data hops are missed you see the broad flow of data from source to target systems. From there, narrowing or enriching the lineage view becomes important, which is where the other levels come in.
Column-Level Lineage: Tracing Fine-Grained Data Dependencies
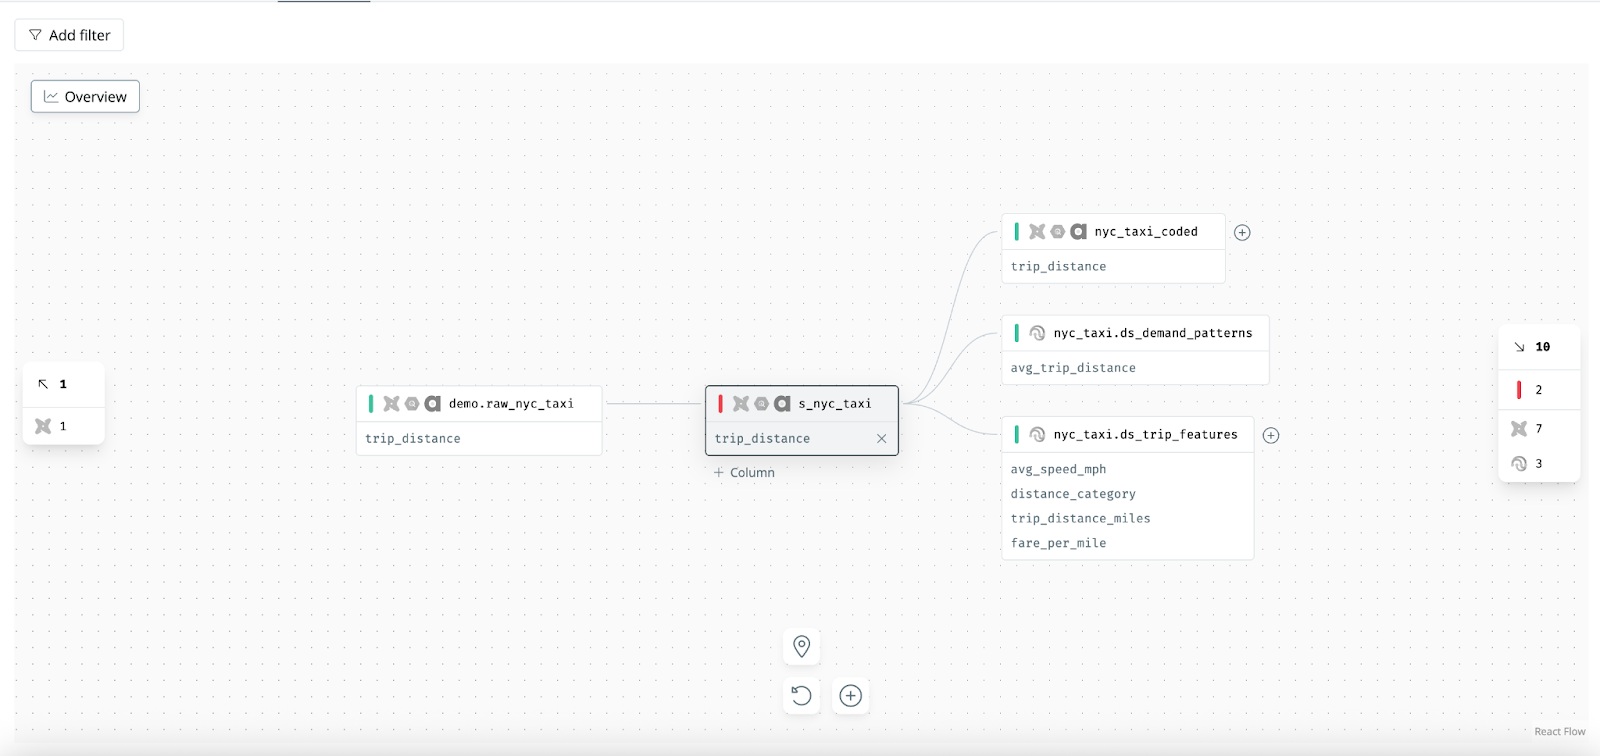
Column-level lineage takes the analysis one step deeper by showing how individual columns of data flow from source to target. Instead of treating a table as a black box, column lineage can answer questions like: Which source columns combine or transform into this derived column? or If I deprecate the “customer_email” field in the upstream table, which downstream columns (and reports) does that actually impact?
In column-level lineage, each node might be a specific column in a table, and the edges map column-to-column transformations. This is useful for impact analysis and troubleshooting. It provides a precise view of dependencies that table-level lineage might obscure. For example, imagine a wide table where a certain KPI column is calculated from five different input columns across three tables, column lineage will show you that exact chain. If that KPI is wrong, you can zero in on which source column or join caused the issue, rather than sifting through entire tables.
By mapping how each column is derived, you get transparency into complex transformations. This helps with validating logic and doing field-level audits. It’s also valuable for cleaning up unused fields, e.g. find all the downstream places a particular column is (or isn’t) used.
It’s worth noting that while column-level lineage is powerful, it can be a double-edged sword if not presented thoughtfully. Exposing every single column linkage in a large DAG could overwhelm users. The key is to make it on-demand and navigable. When done right, column lineage is an enabler for data engineers: it provides precision for debugging and impact assessment that table-level maps alone cannot offer.
Code-Level Lineage: Understanding the Logic Within the SQL
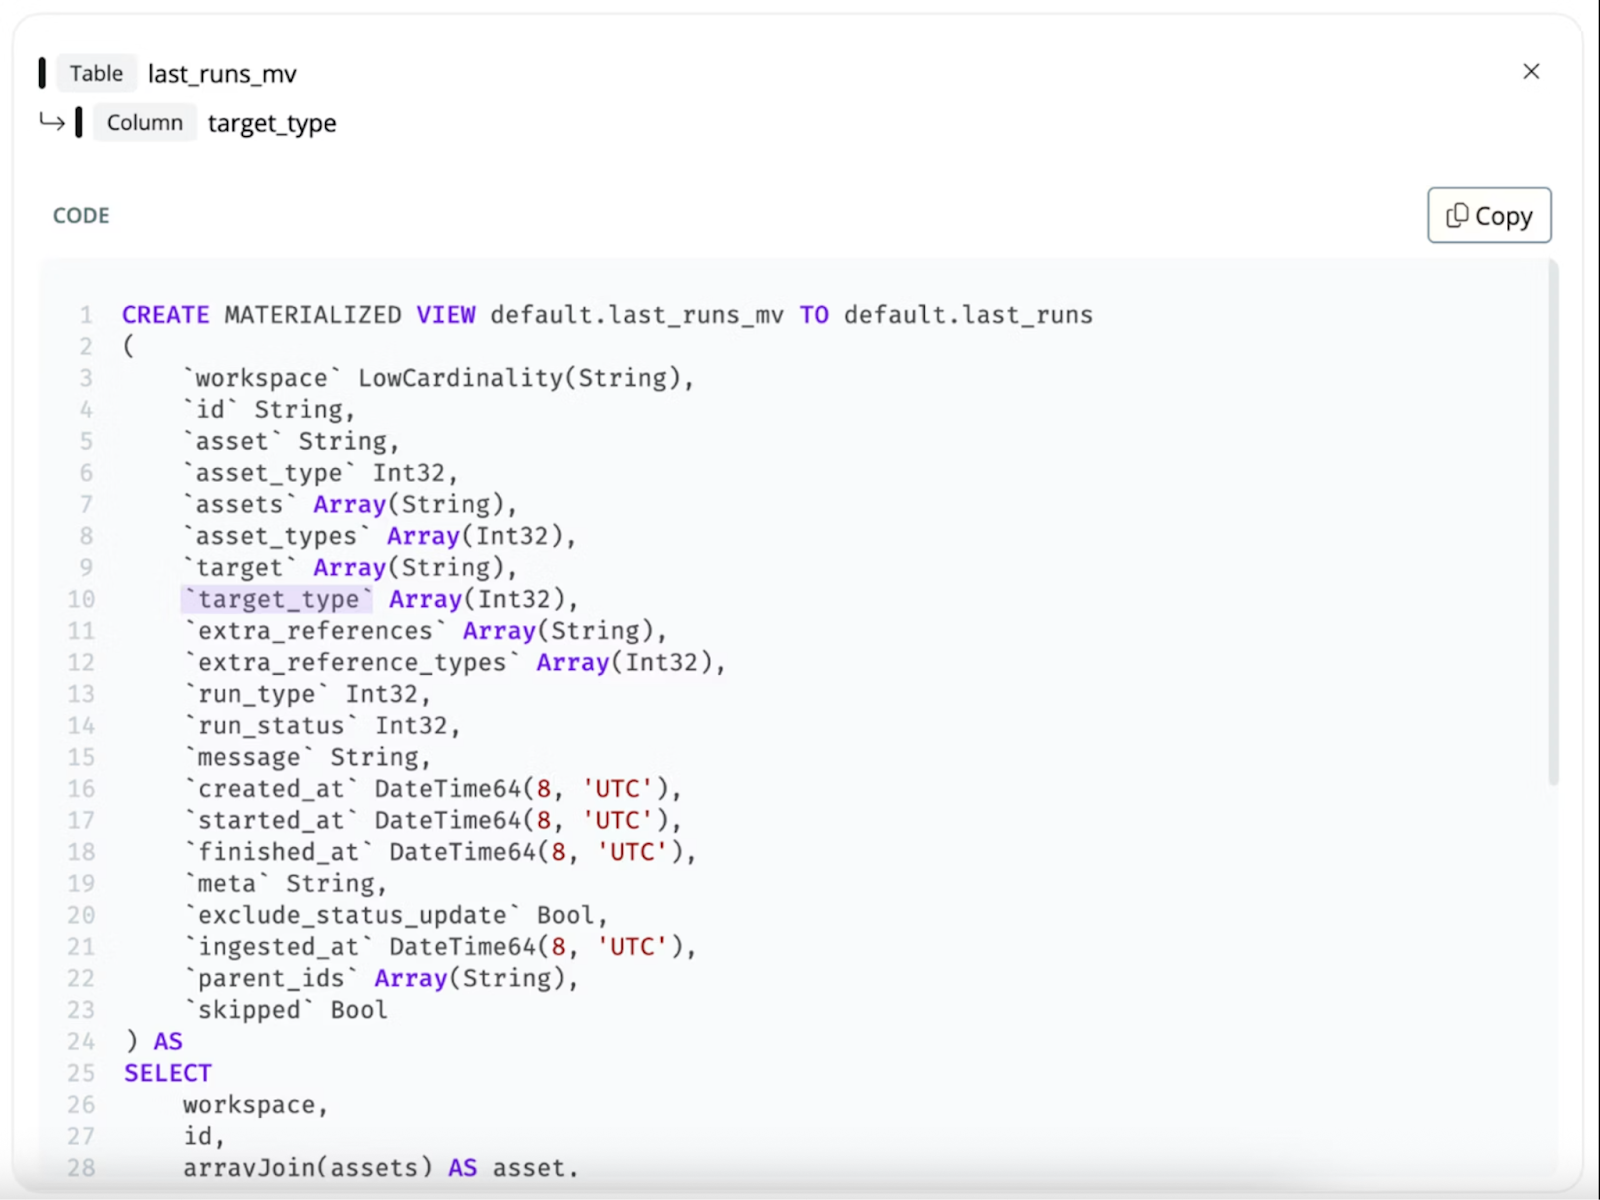
The most granular level of lineage is code-level lineage. This goes beyond showing which columns connect; it actually ties lineage information back to the specific code that produces the data, down to the line or expression. Essentially, code-level lineage lets you drill into a data transformation and see how a value is computed through the layers of SQL logic, not just what the upstream sources are.
Why is this important? Because SQL transformations can be complex, with many common table expressions (CTEs), subqueries, and intermediate steps. Even with column-level lineage, you might know that column X in Table A comes from column Y in Table B, but understanding the exact logic (joins, filters, calculations) requires reading the code. Code-level lineage automates this comprehension. It parses the SQL to map the end-to-end flow of logic: for example, if a dashboard metric comes from a column that was calculated in a CTE, which in turn came from joining two tables, the code-level lineage can step you through each layer of that SQL within the code file.
Code-level lineage is a game changer for refactoring and complex debugging. If you need to change a metric’s logic, code lineage can guide you through every step that metric goes through in the code, so you don’t miss a downstream calculation. It also helps expose hidden transformations that column-level lineage alone might not fully clarify (for example, intermediate calculations or filters within a SQL script). By making the flow of logic visible, not just the flow of data, code-level lineage gives data teams unprecedented confidence to modify code safely.
Data Lineage Tools
Before we list tools, it helps to frame how lineage is captured. Most solutions rely on one or more of these patterns:
- Runtime emission
Pipelines and engines emit lineage events while jobs run. This yields accurate, time-scoped lineage and is resilient to dynamic SQL. Examples include OpenLineage, Marquez, Unity Catalog’s runtime lineage capture, and Spark Spline. - Static or metadata parsing
Tools parse code artifacts and metadata, then infer lineage. Common sources include dbt’s manifest.json, LookML, or SQL text compiled by your transformation layer. Catalogs such as DataHub or OpenMetadata use parsers to infer table and column edges. - System-level telemetry
Warehouses and BI platforms expose query history, access logs, and native lineage views. You can interrogate these directly or via a catalog that harvests them. Examples include Snowflake Data Lineage and Object Dependencies, BigQuery’s Dataplex lineage, Tableau Catalog, and Power BI’s Lineage view.
In practice, mature programs blend all three. Runtime events fill gaps that parsers miss. Parsers provide depth for code-level context. System telemetry gives the authoritative picture of what actually ran.
Lineage isn’t created automatically, you need tools and techniques to capture it. There are a few broad categories of solutions that are able to give you lineage.
- Data Observability Platforms
- Examples: SYNQ, Montecarlo
- Pair lineage with monitoring, testing, and incident management, making lineage actionable during troubleshooting and root cause analysis.
- Warehouse & Lakehouse Native Features
- Examples: Snowflake Lineage, BigQuery Dataplex, Databricks Unity Catalog.
- Platforms provide built-in lineage views and APIs.
- Open Standards & Runtime Collectors
- Examples: OpenLineage + Marquez, Spark Spline.
- Capture lineage as pipelines and jobs actually run.
- Metadata Catalogs & Governance Platforms
- Examples: DataHub, OpenMetadata, Microsoft Purview, Apache Atlas.
- Centralize metadata and stitch lineage across sources.
- Transformation Layer Artifacts
- Examples: dbt manifests, LookML in Looker.
- Use static code artifacts to build precise lineage graphs.
- BI & Analytics Tools
Examples: Tableau Catalog, Power BI Lineage view.- Show end-to-end lineage from datasets to dashboards.
Conclusion: Making Lineage Actionable
Data lineage is no longer a nice-to-have diagram for compliance teams. It’s becoming the connective tissue of modern data operations. By tracing how data moves through pipelines, transformations, and dashboards, lineage provides context for trust, speed, and reliability. When something breaks, lineage shows you not just what failed but who is impacted. When you want to change a model, lineage tells you what downstream assets are at risk.
There are many ways to capture lineage, from warehouse-native features and runtime collectors to catalogs and BI tools. But the real power of lineage comes when it is embedded into daily workflows. That’s where observability platforms like SYNQ shine.
With SYNQ, you don’t have to bolt together lineage from scratch. Lineage is built into the product spanning from your data warehouse through transformations to BI dashboards. You can explore table-, column-, code-, and data product-level lineage in seconds, and because it’s integrated with monitoring and incident management, lineage becomes more than metadata: it becomes a tool you actually use when it matters most.
Lineage is also part of the free version of SYNQ. You can get an accurate view of your lineage in less than 30 minutes.
FAQ
What is data lineage?
Data lineage is the detailed record of how data moves and transforms across your systems. It traces the journey from raw sources in your data warehouse, through transformation logic and pipelines, all the way to dashboards, reports, or machine learning models.
Why is data lineage important?
Data lineage provides visibility, trust, and control. It helps data teams:
- Understand the impact of changes before they’re made
- Troubleshoot issues faster by tracing errors to their source
- Ensure compliance by showing where sensitive data originates and how it’s used
- Improve collaboration by giving business and technical teams a shared view of dependencies
What are the benefits of data lineage for data teams?
Key benefits include:
- Faster root cause analysis during data incidents
- Confident schema changes without breaking downstream assets
- Improved data quality by linking issues to their origins
- Reduced duplication by spotting redundant tables and unused columns
- Audit readiness by keeping a record of data sources, transformations, and flows
What are the different levels of data lineage?
Data lineage can be captured at multiple levels of detail:
- Data product lineage – how entire business-oriented data products depend on each other
- Table-level lineage – connections between datasets and models
- Column-level lineage – tracing individual fields across joins and transformations
- Code-level lineage – linking lineage back to SQL logic for precision and debugging
What tools provide data lineage?
There are several categories of tools that help capture lineage:
- Warehouse-native features: Snowflake Lineage, BigQuery Dataplex, Databricks Unity Catalog
- Open standards & collectors: OpenLineage, Marquez, Spark Spline
- Metadata catalogs: DataHub, OpenMetadata, Microsoft Purview, Apache Atlas
- Transformation layer artifacts: dbt manifests, LookML from Looker
- BI tools: Tableau Catalog, Power BI Lineage view
- Observability platforms: SYNQ, Monte Carlo, Acceldata, which combine lineage with monitoring, testing, and incident management
How do you capture data lineage in practice?
Lineage is captured using a mix of approaches:
- Runtime emission, where pipelines emit lineage events as they run
- Static parsing, where tools analyze code and metadata like dbt manifests or SQL
- System-level telemetry, where warehouses and BI tools expose query logs and dependencies
Most mature teams blend all three for complete coverage.
What makes lineage in SYNQ different?
With SYNQ, you get lineage as part of the data observability platform. Unlike standalone catalogs, SYNQ combines table, column, code, and data product lineage with monitoring, testing, and incident management. SYNQ is also the only data observability platform that has code-level lineage. This means lineage is directly actionable: when an incident occurs, you can instantly see the impacted downstream assets, trace the root cause, and resolve issues faster. SYNQ free version includes lineage as well.
.png)