The Complete Guide to Data Quality
.jpeg)
Data quality is more important than ever. As data powers critical systems from AI models to executive dashboards, poor data quality can cause real harm. Broken pipelines, missing values or biased datasets can lead to failed machine learning predictions, flawed business decisions and customer frustration. This guide is designed to help modern data teams understand, measure and improve data quality, using proven practices and lessons from the field.
What Is Data Quality?
Data quality is not one-size-fits-all. Data quality refers to the degree to which data meets the needs of its intended use. In the modern data stack, data quality is not a single, universal metric. It is context-dependent and shaped by use cases, and business objectives. For example, a machine learning model that you train once a month may not need real-time data but will demand high accuracy, whereas regulatory reporting requires both accuracy and traceability.
The best way to define data quality is to look at your most important data products and ask what it means for them to be trustworthy. From there, you can define metrics that match how your data is used.
Why Data Quality Matters Now more than Ever
The role of the data team has changed. Ten years ago, data teams mostly supported business intelligence or ad hoc analytics. That data was useful, but not essential. Today, data teams own business-critical systems. They feed data to customer-facing apps, power AI use cases and support compliance.
AI and machine learning have raised the stakes further. In traditional analytics, domain experts can often spot errors visually. In machine learning, data issues may go undetected for long periods, quietly degrading predictions or introducing bias. AI systems also rely on large and complex data sets, making manual oversight impractical. At the same time, AI and ML can be leveraged to monitor, detect, and even remediate data quality issues, acting as a copilot for data teams.
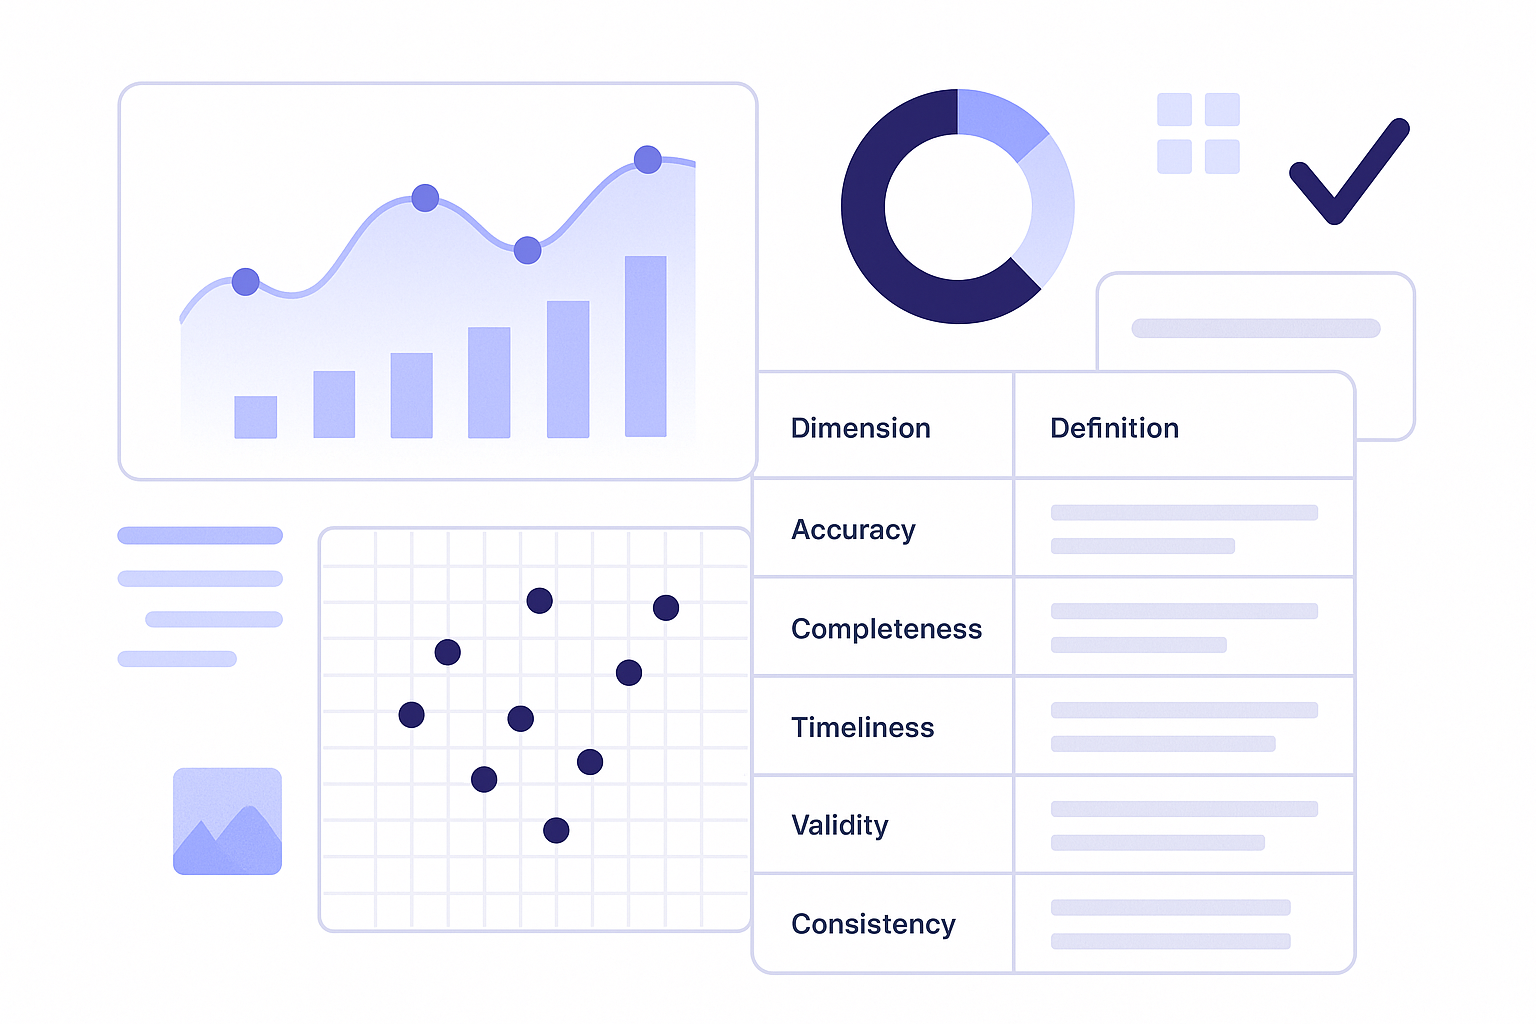
The 6 Core Dimensions of Data Quality
A robust data quality framework is built on six core dimensions, each essential for ensuring that data is fit for its intended purpose.
Timeliness and consistency are often overlooked, especially in organizations with fragmented data sources or multiple teams. In machine learning, for example, stale data can lead to outdated or irrelevant predictions, while inconsistent data can undermine trust in analytics.
How to Measure Data Quality
Measuring data quality starts with understanding that there is no single metric that applies to every organization. The right way to measure quality depends on how the data is used and what value it delivers. A one-size-fits-all approach often leads to vanity metrics that don’t reflect reality.
The most effective way to begin is by identifying your most important data products. These are the dashboards, ML models, reports, or data pipelines that directly support business outcomes. Once you know what matters most, you can define what quality means in those contexts and choose metrics accordingly.
For example, a customer churn model might only be retrained monthly, so freshness might not be a priority, but accuracy could be critical. A sales dashboard, on the other hand, may require daily updates to support team meetings.
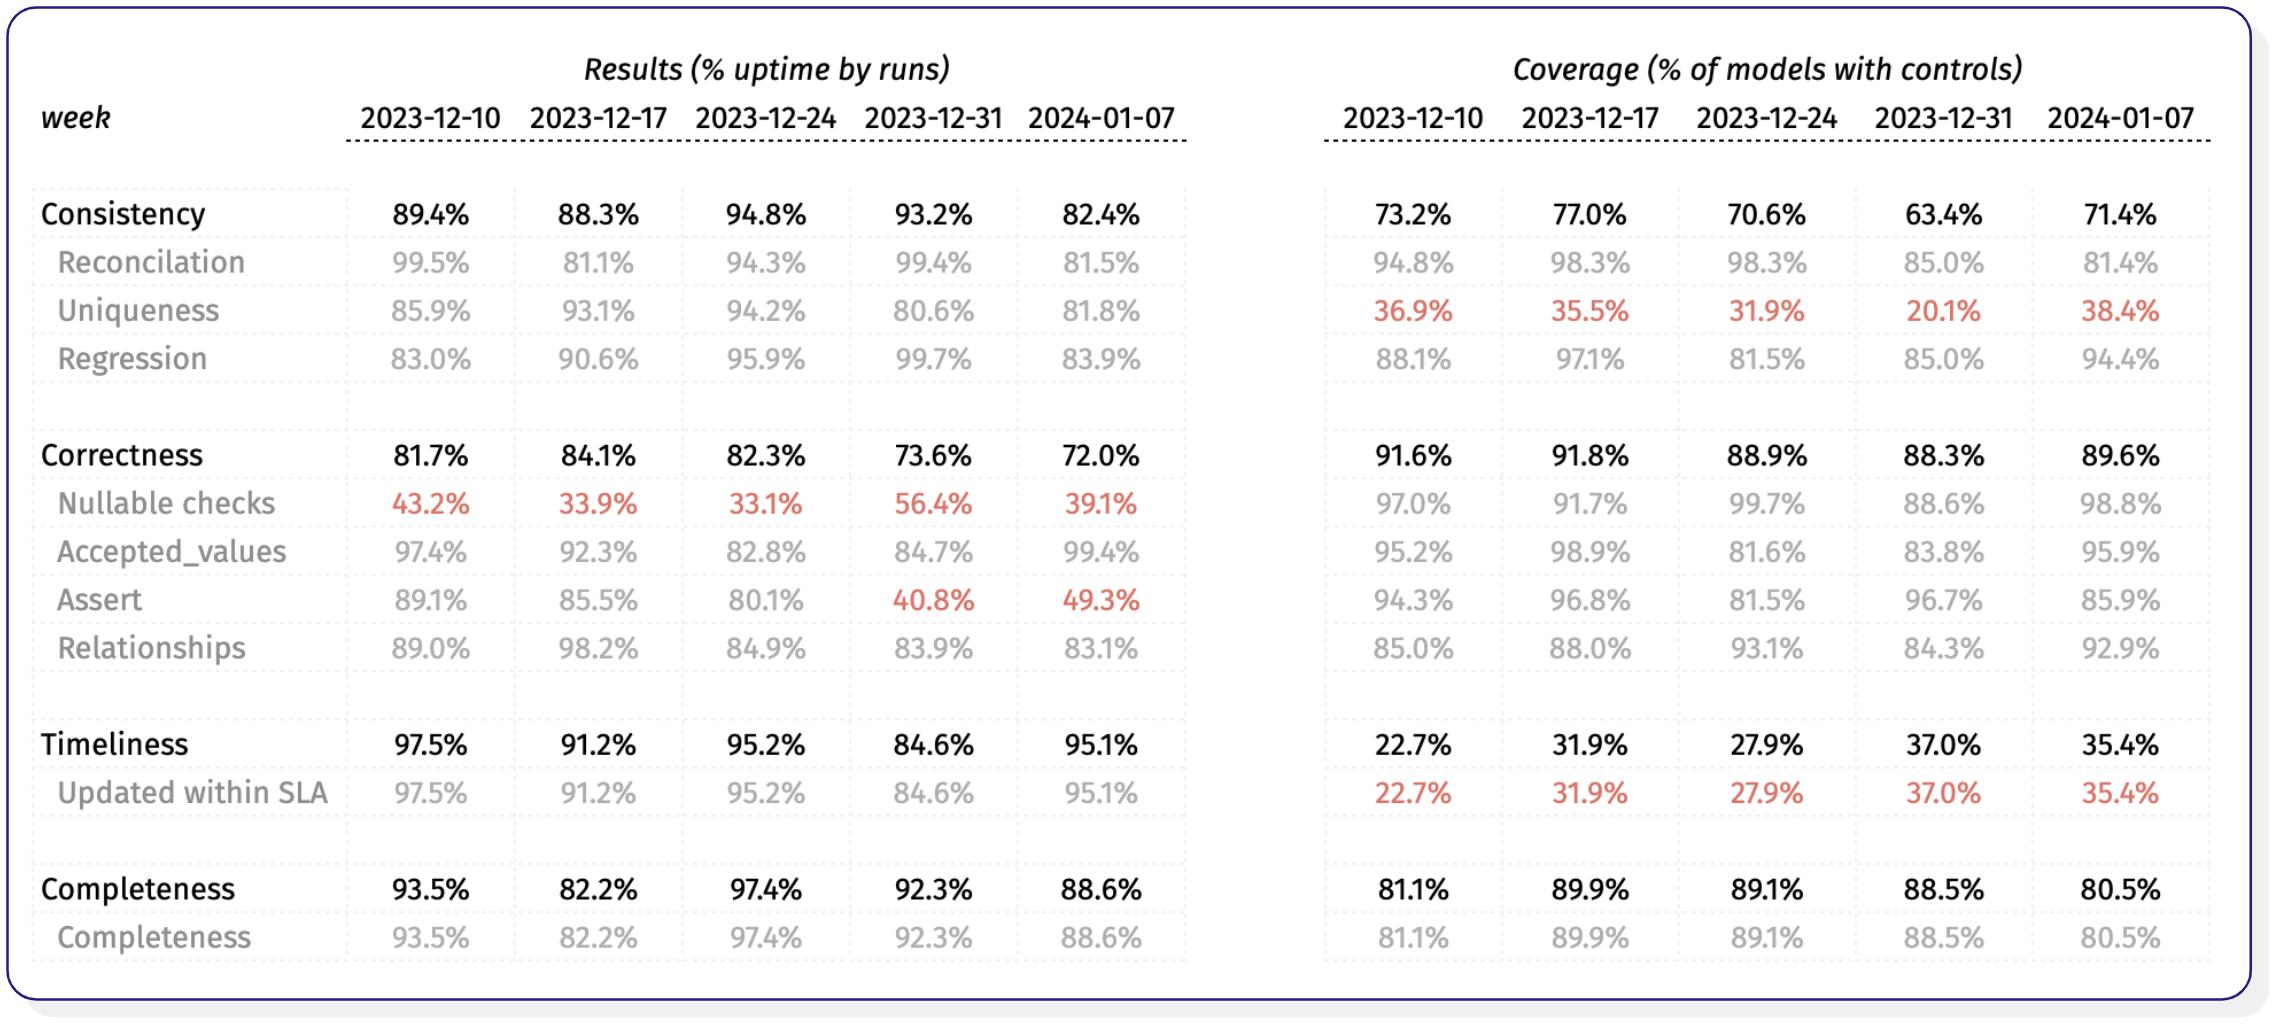
From these use cases, you can define relevant Service Level Indicators (SLIs). These might include accuracy, timeliness, completeness, validity, consistency, and uniqueness. For each metric, it’s important to link the measurement back to business value. Saying a test failed tells you little on its own. Saying that a key revenue dashboard was out-of-date three times last week and delayed decisions is far more actionable.
Operational metrics also matter. Mean Time to Detect (MTTD) and Mean Time to Resolution (MTTR) help you understand how long it takes to identify and fix data quality issues. High MTTD or MTTR indicates you may not be monitoring effectively or responding quickly enough.
To make these metrics meaningful, you also need to segment them. Look at data quality by team, platform, or domain. For instance, you might find that tables maintained by the marketing team fail more often than those owned by engineering. Or that a specific pipeline breaks more frequently than others. These patterns help guide where to invest time and effort.
Ownership is another key piece. For any data product or critical asset, there should be a clearly defined owner. When a data quality issue arises, someone must be accountable not just for fixing it, but for improving the processes that prevent it. Metadata, lineage, and tagging in dbt or your catalog can help enforce this ownership and keep metrics accurate.
At SYNQ, we recommend starting with the data products that are most important to your business and working backwards. Don’t start by trying to measure everything. Start by measuring what matters.
To go deeper into the methodology and tools, you can explore our blog post on Measuring Data Quality and our Guide to Building Data Products, which lays the foundation for defining high-impact assets and setting clear expectations around quality.
How to Improve Data Quality
Improving data quality starts with defining what good looks like. Many teams make the mistake of starting with a checklist of tests or counting how many pass or fail. This creates the illusion of control without solving real problems. A better approach is to work backwards from the business use case. Identify your most important data products and ask what it means for each of them to be trustworthy. Then figure out where the gaps are and how to close them.
For most teams, the first step is recognizing where quality issues actually occur. In many cases, the root causes are not found in your transformation layers but further upstream. If users enter inconsistent data or engineers change schemas without notice, downstream models and reports will inevitably break.
Once you know where problems originate, you can start to implement safeguards. One approach is to catch issues earlier through better testing and monitoring. Tools like dbt allow you to write rule-based tests that validate uniqueness, freshness, or null values. These are essential for catching known issues before they escalate. But tests alone are not enough. Many problems go unnoticed because no one thought to test for them. That is where anomaly detection becomes valuable.
With anomaly detection, you can surface issues that slip through manual testing. These might include subtle schema changes, volume spikes, or delayed refreshes. Machine learning-based monitors learn what normal looks like and alert you when something deviates.
As you identify recurring issues, the next step is to fix them at the source. For example, if a particular Salesforce field is constantly filled with invalid values, the best solution might be to enforce stricter input validation within the CRM. If schema changes from engineering teams are regularly breaking models, introducing data contracts can help. These contracts define expectations between teams, making it clear what data structures are allowed and what changes require coordination.
Data contracts work best when paired with clear ownership. When each team knows which parts of the data they are responsible for, it becomes easier to enforce quality standards. At SYNQ, we recommend tagging assets with metadata about ownership, domain, and criticality. This helps prioritize alerts and guide improvement efforts. If a pipeline feeding your ML model has recurring freshness issues, it should not be treated the same way as a broken internal report.
Improvement also depends on visibility. Without shared metrics, it is hard to know where you stand or what progress looks like. Weekly digests, internal dashboards, and regular reviews help bring quality metrics into the open. Instead of waiting for end users to report problems, teams can proactively track performance and resolve issues before they cause damage.
Some teams even go further and operationalize data quality metrics across departments. By sharing data quality scores with stakeholders and aligning them with business goals, you create a culture where reliability matters to everyone. If a dashboard is consistently delayed, that should show up not just in a data team’s metrics but in the KPIs of the teams who rely on it.
The most effective data teams build quality improvement into their daily workflows. They review incidents, run retrospectives, and add new tests or monitors based on what they learn. They also automate where possible. When a freshness monitor triggers, it creates a ticket or sends an alert to the responsible team. Over time, these small improvements add up to more stable, more trusted systems.
Improving data quality is not a one-time project. It is a continuous effort that involves aligning people, processes, and tools. But when done right, it pays off by reducing fire drills, building trust in your data, and enabling faster decision-making across the business.
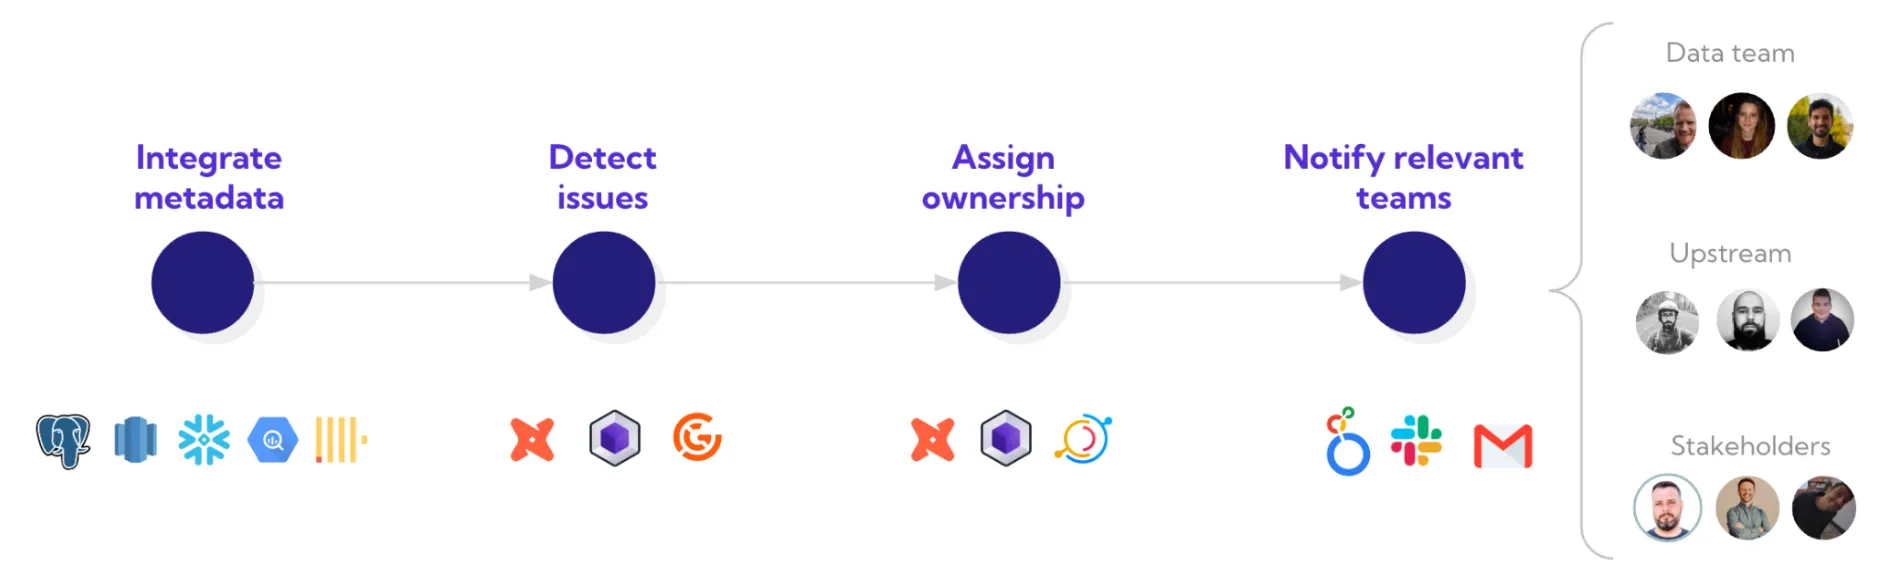
When you are ready to move from firefighting to proactive improvement, platforms like SYNQ can help you detect issues early, assign ownership, and track progress over time. For more details on operational best practices, explore our post on High-Impact Data Governance Teams and our data products guide chapter 3on monitoring and testing.
Data Quality Tools and Platforms
Improving data quality is not just about having the right mindset. It also depends on having the right tools in place. Data quality issues often arise from complexity. As your data stack grows, so does the number of systems, transformations, and handoffs between teams. Tools help you manage that complexity, detect problems earlier, and create more reliable pipelines.
There are three major categories of tools most data teams rely on. The first category focuses on testing and validation. These tools allow you to define rules about what good data looks like and catch violations before they impact production. The most widely used tool in this category is dbt. With dbt, data teams can define tests directly in code alongside their models. These tests might check for things like null values, duplicate keys, or expected ranges. Tools like Dataform and SQLMesh offer similar functionality. The key is that they integrate testing directly into your development workflow, so quality checks happen as part of every deployment.
The second category is data observability platforms, such as SYNQ, that focus on anomaly detection and monitoring. These tools help you find issues that rule-based tests might miss. Rather than relying on predefined rules, anomaly detection tools learn from your historical data patterns. They monitor things like freshness, volume, schema drift, and distribution changes, flagging deviations that could indicate a problem. Some tools use machine learning to adapt thresholds over time. This helps reduce false positives and keeps your alerting focused on what actually matters.
A third category of tools focuses on metadata, discovery, and collaboration. These tools provide visibility into what data exists, how it flows through systems, and who is responsible for it. They can help teams tag critical assets, define data products, and document ownership. When an issue does arise, these tools make it easier to trace its impact and assign accountability. Popular tools in this space include data catalogs like Atlan, Collibra, and Alation, as well as open-source options like Amundsen and DataHub.
It is worth noting that many of these tools now offer overlapping features. Some testing tools are adding monitoring. Some monitoring platforms are adding catalogs. As a result, your choice of tool often comes down to how well it fits into your existing workflow. If your team is already using dbt for transformation, it makes sense to extend it with tests and metadata tags. If you are trying to improve reliability across dozens of pipelines, a standalone monitoring platform might be more appropriate.
No matter what tools you choose, the goal should be the same. You want to detect issues before they reach users, understand where problems come from, and improve quality over time. That means choosing tools that support both automated checks and human workflows. You should be able to trace an issue from a failed test or alert, to the responsible owner, and to the system where the fix needs to happen.
If you are starting from scratch, begin with testing tools that fit your development stack. Add monitoring as your data products become more critical. Then layer in discovery tools to improve documentation and collaboration. As your stack evolves, so will your needs. The best tools grow with you.
The Role of Data Observability in Ensuring Data Quality
Data observability plays a foundational role in achieving high data quality. While testing ensures known issues are caught through rule-based checks, observability helps teams detect and resolve unexpected problems that slip through the cracks. Together, they form a complete picture of how healthy and reliable your data systems are.
Observability gives you continuous visibility into the behavior of your pipelines. It tracks data freshness, volume, schema changes, and distribution patterns. When something deviates from the norm, observability tools can flag it in real time, helping you act before the issue impacts users or downstream models.
This becomes even more important in systems powered by AI and machine learning. In a dashboard, a human might notice if a number looks off. But in an ML model, a single corrupt feature might skew predictions without anyone realizing. Observability helps fill that blind spot by automatically surfacing anomalies that would otherwise go unnoticed.
AI is also making observability smarter. Instead of static thresholds, modern platforms use AI and machine learning to understand normal patterns and highlight deviations that matter. They can correlate issues across lineage and suggest likely root causes, reducing the time it takes to troubleshoot and fix problems.
Observability is not a replacement for testing. It is a complement. While testing catches the errors you expect, observability helps uncover the ones you do not. Together, they help teams deliver data that is accurate, timely, and trustworthy.
Who Owns Data Quality?
Data quality is a shared responsibility. While data engineers and analytics engineers are often on the front lines, ensuring transformations are correct and pipelines are stable, most quality issues originate far upstream. The people who input or generate the data are often not the same people who are expected to maintain its quality.
Many of the most common issues come from operational systems like Salesforce or internal product data streams. These systems are typically owned by go-to-market teams or software engineers. Still, when the data breaks downstream, it is usually the data team who gets the alert, who investigates the issue, and who is held accountable.
To solve this, teams need to shift accountability closer to the source. The best way to do this is by measuring quality at the level of individual systems or teams. When you can clearly show where errors are coming from, you can have better conversations about ownership. If the majority of errors come from one specific source, that is where remediation should begin.
Metadata plays a key role here. When assets are tagged with clear ownership, and quality issues are surfaced in that context, it is much easier to assign responsibility and drive action. For teams using dbt, this can be done using tags and model metadata. More advanced platforms allow alert routing and reporting to align with those definitions.
In larger companies, a data governance function can help standardize these practices. Governance teams often define which assets require strict SLAs, who should be notified when things fail, and what escalation paths look like. But even without a centralized function, teams can adopt shared conventions that make quality measurable and accountable across the business.
True ownership of data quality means more than just maintaining tests. It means aligning teams around shared expectations and giving every contributor visibility into the impact of their data. When everyone knows how their data is used and what is expected of it, quality improves as a natural outcome.
Common Data Quality Challenges (and How to Solve Them)
Many data teams struggle with quality, not because they lack tools or talent, but because their approach is misaligned with the actual problems. One of the most common mistakes is focusing on metrics that are easy to track but don’t reflect real-world impact. Measuring the percentage of passing tests, for example, may look good on a dashboard, but it doesn’t reveal whether those tests are meaningful or whether the business is affected when they fail.
Instead, teams should work backwards from the use case. If your sales dashboard is frequently stale or incomplete, that’s a quality issue that matters. If your machine learning model rejects valid users because of upstream data gaps, that’s a quality failure with real consequences. Tracking these failures at the data product level gives you a much clearer picture than counting test results in isolation.
Another mistake is failing to segment. When everything is measured in aggregate, it’s difficult to know where problems are concentrated. Breaking down quality by team, domain, system, or owner helps identify which areas need attention. This also makes it easier to drive accountability, especially when ownership is clearly defined.
Teams also run into trouble when every department or team defines data quality in their own way. Without consistent standards, quality becomes subjective. One team might treat freshness as critical while another ignores it entirely. To avoid this, companies need shared definitions for what quality means, how it’s measured, and what to do when it degrades.
Finally, some teams focus all their energy on fixing downstream issues without ever addressing the root cause. If a field in Salesforce keeps getting populated with invalid data, you can write all the tests you want, but the problem will persist. It’s better to fix the issue at the source, whether that’s validation, training, or a data contract with engineering, than to repeatedly clean up the fallout.
Avoiding these pitfalls starts with a mindset shift. Instead of treating quality as a set of technical checks, treat it as a product of your data workflows, team processes, and shared standards. The most successful teams don’t just catch issues — they prevent them by designing for quality from the start.
Conclusion: Making Data Quality a Competitive Advantage
Data quality is no longer just a technical concern. It is a foundational pillar for delivering trustworthy data products, training reliable AI models, and making confident business decisions. When quality breaks down, the consequences ripple across the organization, affecting operations, customer experiences, and strategic outcomes.
Forward-thinking data teams treat data quality as a shared responsibility, not just a data engineering problem. They anchor quality efforts to the most important use cases and measure what matters. They go beyond surface metrics and link quality back to business impact. They use a mix of testing, monitoring, and metadata to track where issues happen, why they happen, and how to fix them at the source.
They also treat quality as a capability that compounds. With the right foundations teams can move from reactive firefighting to proactive prevention. As AI takes on more of the burden, teams will spend less time chasing issues and more time improving the systems that matter most.
Data quality is not just about avoiding problems. It is about building confidence, driving better outcomes, and earning trust from your stakeholders, your customers, and your business. Done well, it becomes a competitive advantage.

.png)
.png)