Data team as % of workforce: A deep dive into 100 tech scaleups

Note: You can explore all the data of this analysis here: databenchmarks.com
In our experience leading data teams, a recurring question has always been: “what is the right ratio of data people in my company”. The question typically comes up in an important context:
- You’re just getting started building a data team and want to know how many people you should aim to hire
- You’ve been asked to justify what data should look like in a scaling organisation that just received a new funding round
- Your company is downsizing and you want to know what the implications may be
We’ve analysed data from 100 US and European scaleups to help answer these questions.
The range for most companies is between 1-5%. It’s a broad range, and it should be, as there’s no one-fit-all number.
We frequently speak with companies who have already set up dbt and have their most important dashboards in place. They’re often challenged by other members of the leadership team that there’s little left to gain from investing more in data. This is almost always a misconception. Nobody describes this better than Benn Stancil:
“The difference between what Nate Silver creates in Tableau doesn’t look much different than what all of us would create. But that doesn’t mean his work isn’t magnitudes more valuable than ours - it just takes a more discerning eye to see it. Because of this, I think companies significantly underinvest in data expertise.”
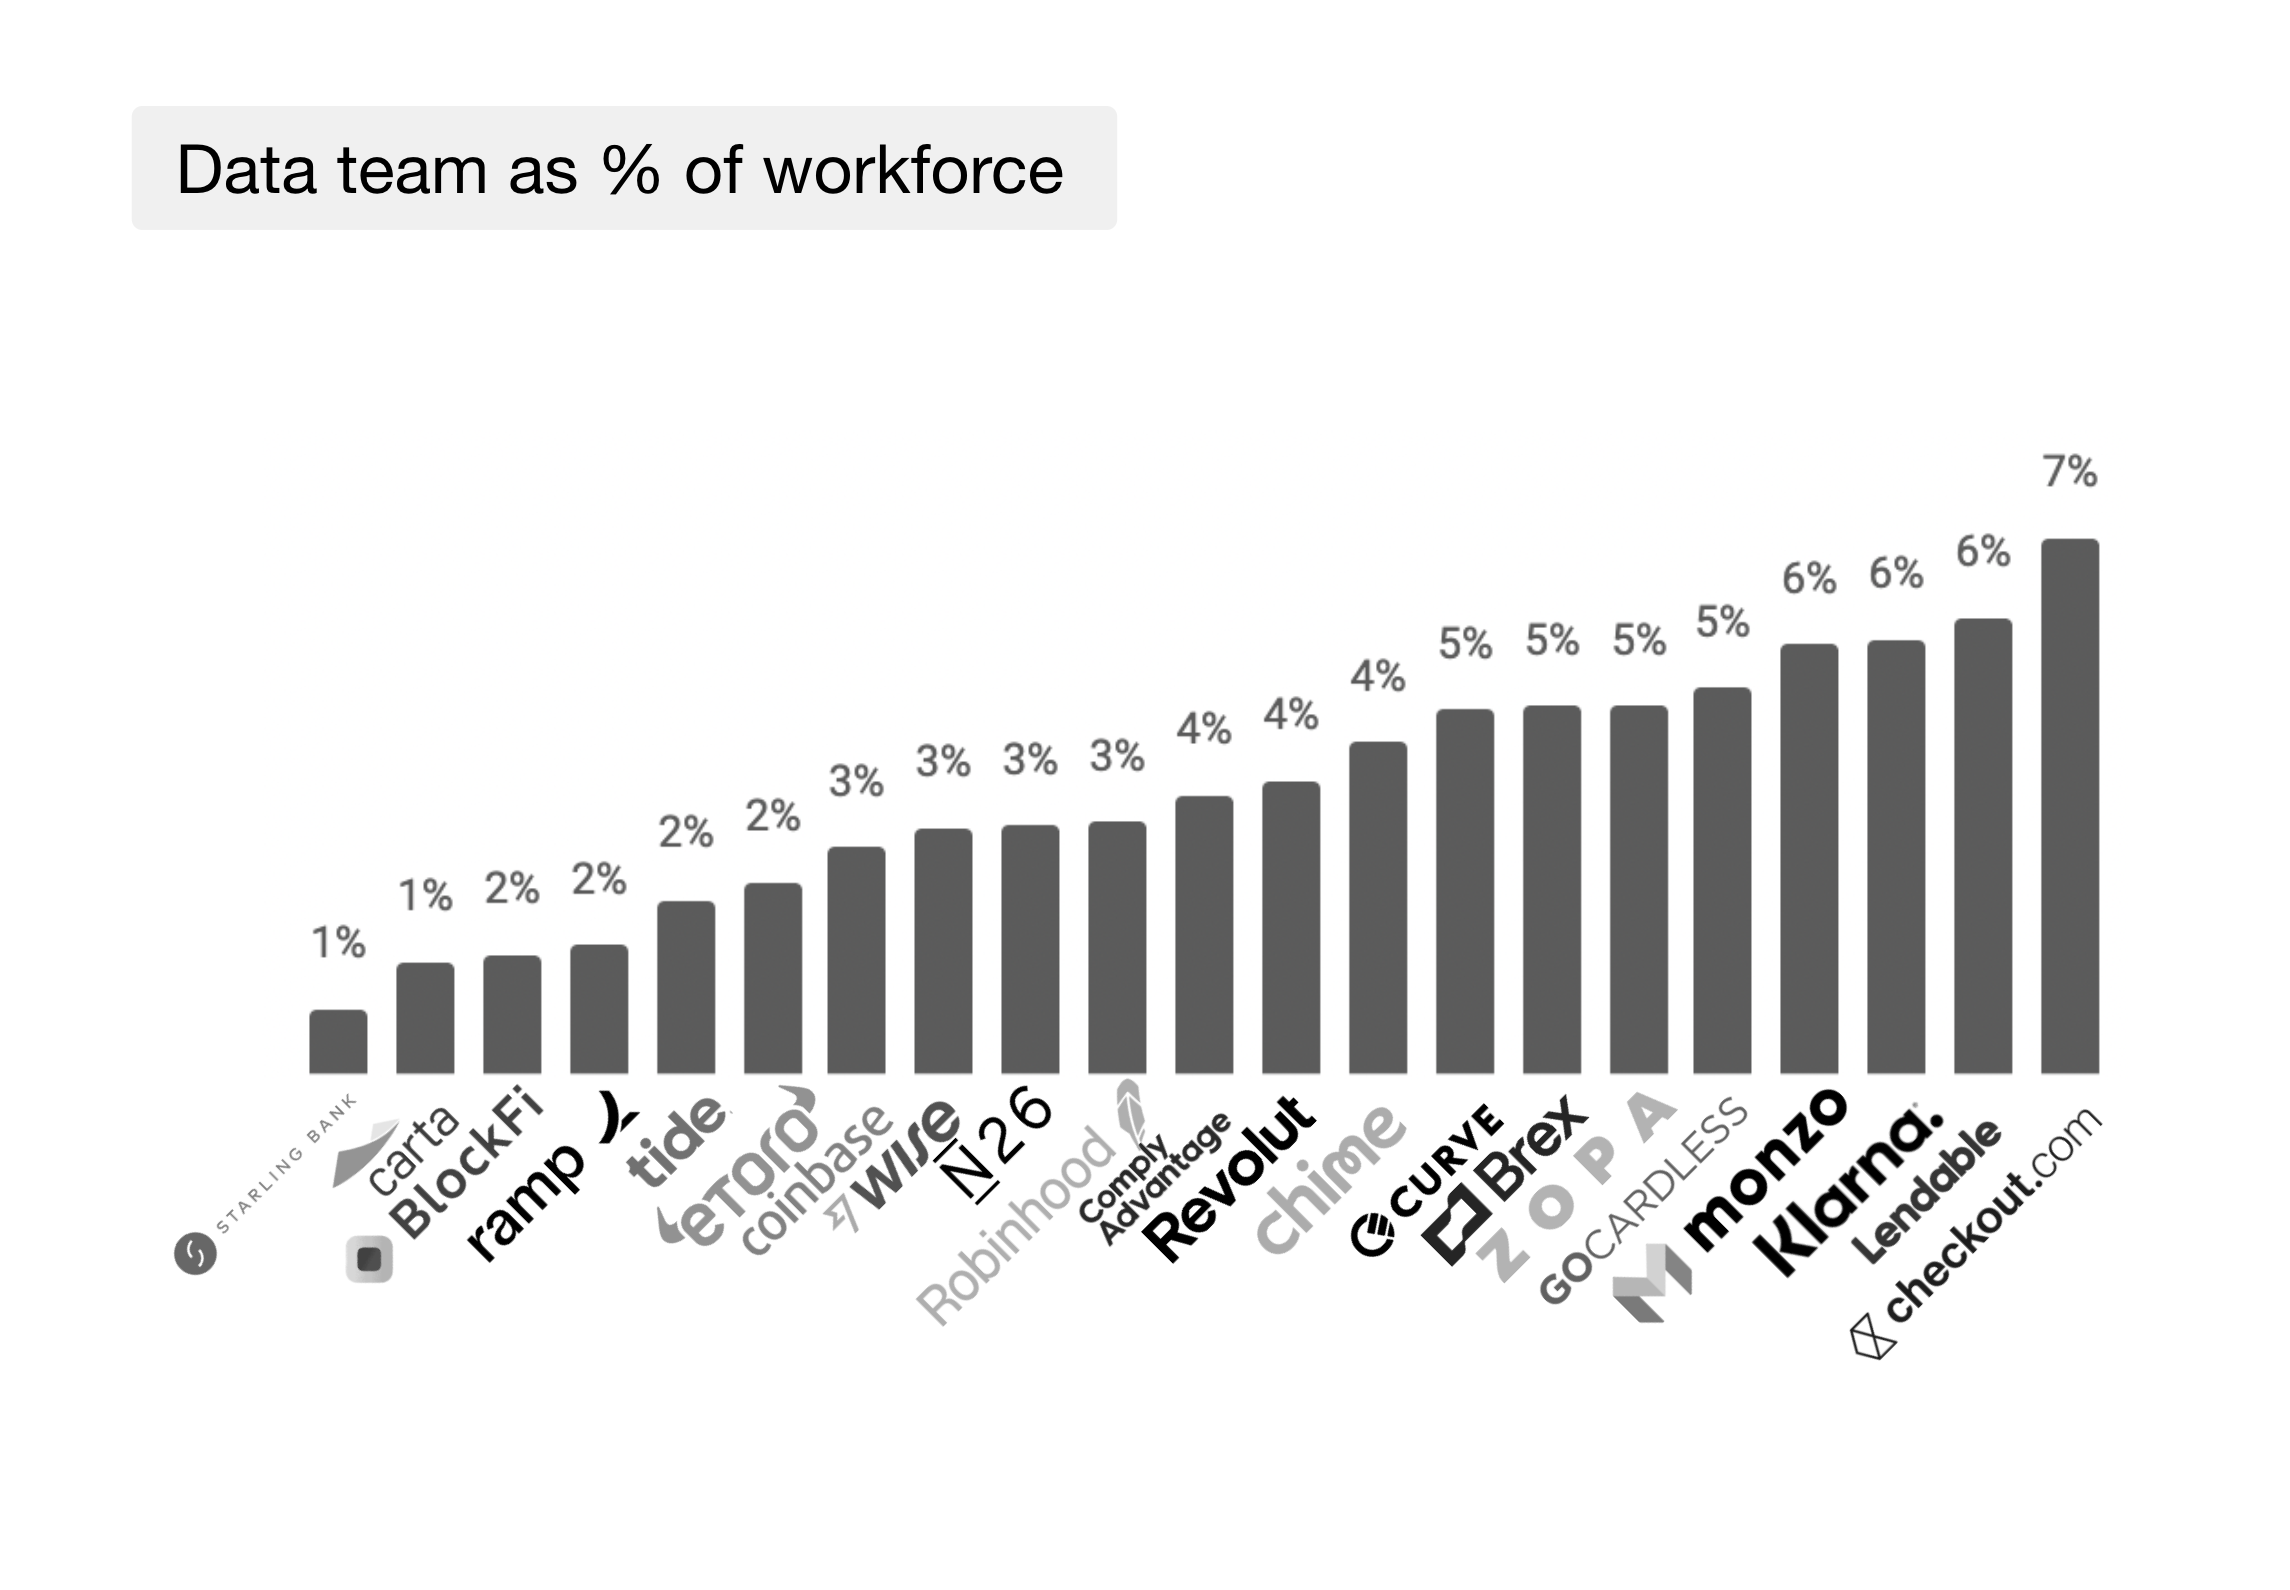
Ratio of data people in 100 top tech scaleups
Looking at the ratio of some well known scaleups gives a good benchmark to understand how other companies are structured.
The median data team as percentage of the tota workforce is 3%.

Data team size by company vertical
Fintech companies come out on top with 3.5% of the workforce being in data roles while B2B companies have the lowest ratio at 2.4%.

B2B (i.e. Talkdesk, Figma, Notion): This is the vertical where data people account for the smallest share of the workforce. Companies here have fewer, larger customers and it’s more difficult to run A/B tests or deploy machine learning models at scale. Often differentiation happens through sales and engineering efforts. However, with the shift to product-led growth (PLG), data is starting to play a more important role.
B2C (i.e. Cazoo, Opendoor, Oscar): These companies often have millions of customers and are well placed to run large scale A/B tests, deploy machine learning models and drive their business through data. The type of data work is already established around use cases such as funnel optimisation or improving marketing spend.
Fintech (i.e. Robinhood, Monzo, Revolut): These companies on average have the highest share of the workforce in data roles. Fintech companies both have business-critical data use cases such as the need to report accurate data to regulators. They also have a wealth of opportunities to directly improve their core business with data, for example by building ML models to predict fraud, determine who is eligible to get a loan or streamlining customer operations.
Marketplaces / physical goods (i.e. HelloFresh, Flexport, VOI): These companies have tight profit margins and data can often be used to directly improve the user experience. Data roles often merge closer with engineering roles as data systems need to go into production services.
Data to engineer ratio as an alternative metric
The overall data team as % of workforce only shows one side of the story. For example, while companies in the marketplace vertical have a smaller % of people in data roles compared to fintech companies, they have a higher ratio of data to engineering roles. This makes sense as they typically have more employees in operational roles which makes the data share look relatively smaller.
A deep dive into the data to engineer ratio reveals that companies in the marketplace vertical have the highest data to engineers ratio.

The sum of data work as an alternative measure
The better your company gets at making the right data available and using it for decision-making, the more people will start using data.
If you’re a company with high data maturity, you’ll have highly skilled account executives who are starting to build custom Looker dashboards. And you’ll have product managers using analytics tools themselves to analyse the outcome of A/B tests. None of these will be counted as incremental data roles but the sum of data work done in your company will grow exponentially.
You benchmark will shift from just looking at data roles as % of the workforce to looking at the sum of data work that happens across the company.

Summary
If you’re thinking about what the right share of data as % of the workforce should be then consider these points
- The median data as % of the workforce is 3% with most companies falling within the 1-5% range
- You can’t always use data roles as % of the workforce as the only benchmark. Consider other benchmarks such as the data to engineers ratio to give a more balanced perspective
- Fintech and marketplace companies are most heavily invested in data today
- If you have the right amount of people in data roles you can expect to see the sum of data work across your company grow exponentially


