Incident management for data teams

Data teams are no strangers to incidents. But there’s often no standard way of acting on data issues and many teams only sporadically declare data incidents.
In this post we’ve teamed up with Jack Cook, analytics manager, from incident.io. incident.io have helped hundreds of engineering teams manage tens of thousands of incidents so there’s a thing or two we can learn from them.
The five steps of incident management
The key components of the incident process can be broken down into five steps

In practice we often see some of the steps above being skipped. While the issue resolution workflow shouldn’t be too time consuming skipping one or more of the steps above can lead to issues like:
- Unclear definitions of importance makes the wrong issues take priority
- Failure to communicate that an issue has been detected means that stakeholders use wrong data
- Root cause analysis ending up with the same few data heroes each time
- Not learning from incidents and making the same mistakes over and over
1. Issue detection
In the last resort you learn about issues from stakeholders or end-users but if you’re taking the quality of your data seriously you’re likely running manual or automated data tests to catch issues proactively.
Manual tests
Manuel data tests should be the backbone of your error detection. These are curated based on your business circumstances and should at a minimum cover your most important data models and sources. Well built tests help you catch issues before stakeholders and simplify the debugging process by highlighting or ruling out where issues occurred.
We’ve written an in-depth guide with ten practical steps to level up for tests in dbt.

After you have the basic tests in place, you can explore
- Using source freshness to proactively catch stale data
- Advanced tests from a library such as great expectations
- Regression tests to detect changes on historical data
Anomaly detection
Your first resort should be manual tests as these can help cover gaps and tightly couples your business knowledge to expectations from the data. Adding checks to automatically detect anomalies on your data can be helpful to learn about issues that your manually controls may not capture
Anomaly detection controls can help you detect issues across quality, freshness, volume and schema issues
- Quality: Automatically run data checks on parameters such as NOT NULL and uniqueness to catch common quality errors and give you insights into where the data deviates from what you’d expect
- Freshness: Can help you automatically detect if sources or data models are stale so you know about missing data before stakeholders
- Volume: Volume can give you an idea of the completeness of your data. If you normally have 500 rows and suddenly see 5,000 new rows something may be off
- Schema: Proactively knowing about upstream schema changes can give you an idea if the expected data type changes and if that’s in line with your business expectations

2. Incident response
Your incident response plan helps guide what to do when you have an issue, when an issue should be considered an incident, what the severity is, who should resolve it and be kept informed.
When to declare an incident
Declare early and often.
You should get into the habit of declaring incidents as soon as they happen. Also, prioritising consistent and frequent communication throughout the response process helps build trust with folks that depend on your data.
When you declare an incident, think about:
- What’s broken? Does it seem serious, or do you need to triage what’s going on before declaring an incident?
- Who needs to know? Is it just going to affect the Data team, dashboard users or some other group?
- What do you need to know? Don’t wait until you know what the root cause is
Assess the severity of the incident
Sometimes, incidents will happen that don’t have any material impact on the business. On the other hand, others may require an immediate response. Dealing with these two types of issues requires a very different approach, but too often, this is not explicitly defined. This leads to negative side effects such as important issues not being acted on fast enough or non-important data issues derailing the data team.
As a rule of thumb these three factors can help you gauge the severity of a data issue:
- Critical use case: Does the data that’s impacted have a business-critical use case?
- Downstream impact: How many downstream assets and who else is affected?
- Magnitude: What is the impact on the underlying data?
It’s important to be able to quickly assess the severity of an issue so you know what urgency to treat it with. It’s also wise to have a common understanding across the organisation of what’s expected for different levels of severity.
For example
- Low severity: Add to the backlog to fix it by the end of week. E.g. Non-critical issue with low downstream impact
- Medium severity: Let stakeholders know and fix the issue by the end of the day. E.g. Non-critical issue and high downstream impact
- High severity: Stop everything you’re doing to fix the issue right away. E.g critical use case with high downstream impact
Read more about designing severity levels for data issues in the guide below.

Create an incident channel to keep communication in one place
At this point, you’ll want to think of a name for your incident. This is typically a summary of what is broken. You’ll also want to include pertinent information such as a description of the incident so far and its severity

If you want to check that the issue warrants an incident, or confirm the severity before raising an incident, then you should triage the problem first before declaring it as an incident. But don’t be afraid to raise the alarm, false positives are better than false negatives!

Keeping communication in one place is key to making sure that everyone is on the same page.
Assign roles, and overcommunicate throughout
Typically, you have 2 types of people who get involved in an incident:
- Collaborators: who actively participate in responding to the incident
- Observers: who need to keep informed of what’s going on
For each incident, one of the collaborators should take on the lead role. The lead should be in charge of making sure there are regular updates, that actions are assigned to the right people, and that the right people are being informed of impact & updates.

Observers, on the other hand, can interact with incidents in several ways:
- Follow along in the incident Slack channel
- Read updates posted outside of the channel
- Read a post incident summary of what happened
You should think about who your audience is, what level of detail they’ll care about, and how you want to communicate with them.

To on call or not
Being “on-call” means, typically, being contactable at any point in the day (or night!) to respond to incidents.
This is common in the world of software engineering. If your app breaks you don’t want to wait until morning for it to be fixed!
As the data function adopts more of the practices of software engineering (such as thorough documentation and testing of code with dbt), data is owning more things that directly impact your product, such as a recommendation algorithm or a customer facing dashboard.
With this comes a question: to on call, or not? Paying a data engineer to be responsible for all out of hours pipeline failures can make sense if:
- Your data pipelines are critical to your product, and can’t wait overnight to be fixed
- You can cleanly carve out the parts of your pipeline that need 24 hour availability from those that aren’t critical
- You have the team size to effectively rotate around this responsibility
This final point is crucial. Having a small data team with 1-2 people responsible for anything out of hours (especially in an org with 10s of people) is a recipe for burnout. If you don’t have enough people to rotate this responsibility around, but need 24 hour availability, consider putting a runbook together so that the responsibilities can be shared with a broader software engineering team (that probably have well established on-call practice).
3. Root cause analysis
Fast root cause analysis helps reduce data downtime and free up time for the data team. 90% of data issues can typically be attributed to
- Test error–getting to the root cause of a test error
- Upstream issues–understand upstream changes or errors
- Code changes–finding recent code changes that could have introduced an error
- Data changes–understand changes in the underlying data
Test error
If you learn about a data issue from a manual or automated test you’ll have useful information about the test error at hand that can help you debug the issue.
With dbt you can leverage the compiled code for test errors to quickly understand which records have failed the test and investigate those in your data warehouse. The target/compiled directory contains select statements that you can run in any query editor.
It can be helpful to write the failures to a database if you want to come back and understand historical failures or share specific examples. dbt has a store_failure functionality that can help you with this.
Sometimes people outside the data team are better placed to resolve issues. For example, an insurance company uses store_failures to write errors to a table using schema specified to keep track of duplicate issues. They have built a Tableau dashboard on top of this and shared it with the Underwriting Team. Each time there is an issue, the underwriting team can see it in Tableau and resolve it directly in the source system.
models:
 - name: my_model
   columns:
     - name: my_column
       tests:
         - unique:
             config:
               store_failures: true  # always store failures
Upstream issues
It’s more difficult to debug issues that happen upstream and in the worst case it feels like searching for a needle in a haystack. Here are a few questions you can ask yourself that will help you pin down potential root causes.
- Can I rule out if the issue happened in the data warehouse and should be escalated to the engineering team?
- What’s the most upstream source I can start by investigating myself?
- Was there an upstream test error that could explain the issue?
- Which upstream models feed into my model?
- Which systems sit upstream from my data source?
- Which team owns the upstream system from my source that I can go to?
Code changes
It’s not uncommon for a recent code change to have broken something downstream. If you’re in a small data team you are aware of all changes that are going on, but in larger teams it can be difficult to keep track of everything.
Most Git platforms let you see code changes ordered by date both on a model level and for your entire repository.
Start by looking at code changes on the data model. This gives you a direct view into code changes that could have caused the issue, and who made the change.
Inspect all code changes in your repository. There may have been code changes on models that sit upstream of the model you care about. If you know when the issue occurred, you can look for code changes that happened across your repository in that period.
Data changes
Data changes are often the most difficult type of issue to debug. This type of issue happens when some data has changed in an underlying system causing a downstream dependency to be wrong.
Snowflake and BigQuery provide powerful features for seeing how your data looked at a previous point in time which can help you pinpoint where the issue may have originated.
- Snowflake time travel: Querying and restore historical data in tables, schemas, and databases for up to 90 days
- BigQuery time travel: Querying and restore historical data in tables, schemas, and databases for up to 7 days
In the BigQuery example below, you can see how the sum of revenue per MQL id has changed for the same day. This can be really helpful information to bring along to the owners of your source systems to understand exactly what has changed.
with yesterday as (
 select * from `prod.analytics.stg_closed_deals`
 where date = ‘2023-01-01’
),

last_week as (
 select * from `prod.analytics.stg_closed_deals`
 where date = ‘2023-01-01’
   for SYSTEM_TIME as of timestamp_sub(current_timestamp(), interval 7 DAY)
)

select
yesterday.mql_id as mql_id,
yesterday.declared_monthly_revenue - last_week.declared_monthly_revenue as diff

from
yesterday
left join last_week on yesterday.mql_id = last_week.mql_id

order by 2 desc
4. Resolution
There are two main components to the end of an incident: closing the incident out, and putting controls in place to make sure that it doesn’t happen again (where possible!).
The first part, closing the incident, needs clear communication to all of the stakeholders involved.
Again, this is a trust exercise. A clear picture of what went wrong, why it went wrong, and what’s going to be done to prevent it happening again goes a long way, especially with non-technical stakeholders who won’t be in the details.

5. Learnings
Another step in closing out an incident is putting controls in place to prevent a repeat incident.
If it was a minor incident, typically involving a handful of people with minimal impact, this process doesn’t need to be too intensive. You should create a list of follow-ups to put controls in place, and make sure they’re carried out; this should be sufficient.
If it was a major incident, with a lot of impact or external stakeholders who want to understand what went wrong (and why), you’ll want to run a more formal process known as a post mortem.
Follow-ups
Whether it was a major or a minor incident, you’ll likely have follow-up actions to prevent a repeat incident. You should make a list of follow-ups, and assign them, to make sure that the root causes are addressed.
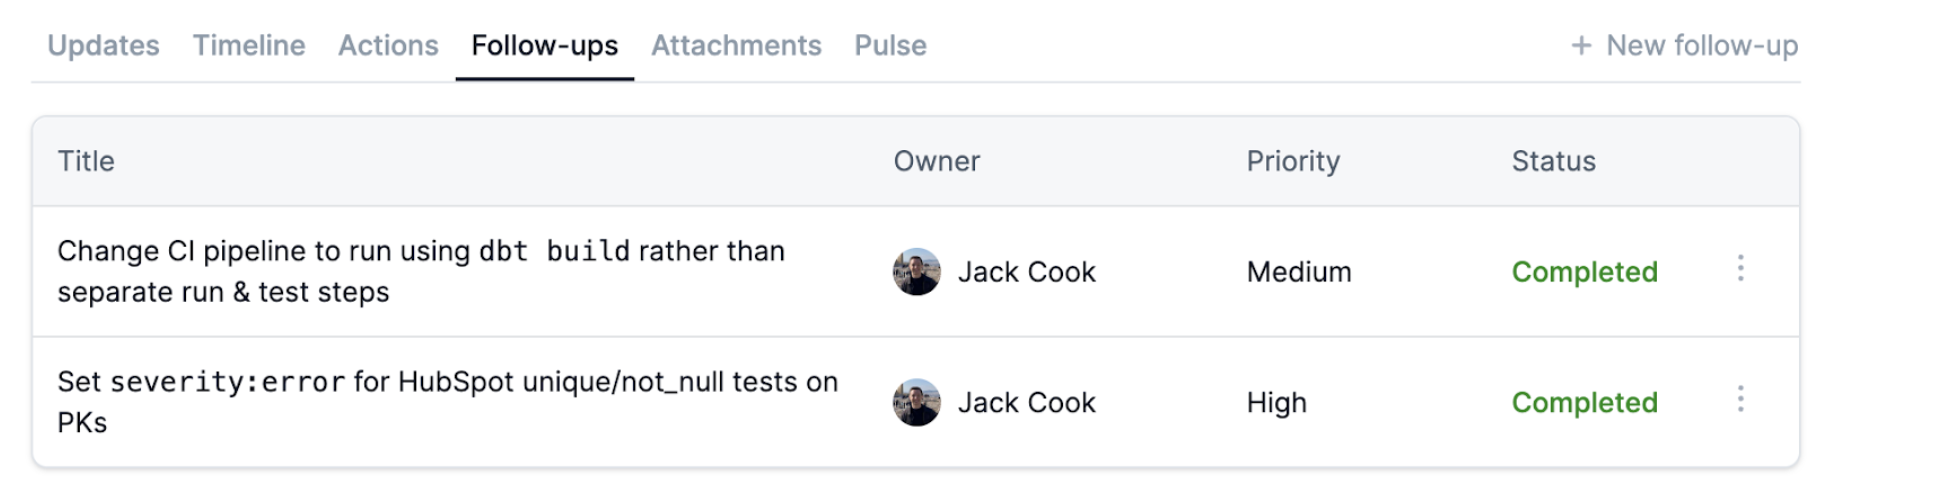
Post incident follow-ups will typically fail unless:
- They have clear owners
- As an organisation, you have a process around keeping follow-up owners accountable to timelines
Post mortem
For more severe incidents, a post mortem will involve a meeting between the collaborators (and any external stakeholders), and will typically have a document with a summary of the incident itself, to discuss what happened and how it could be prevented in future.

Post mortems are useful to understand:
- What went wrong
- Why it went wrong
- The impact it had on external stakeholders
- What to do to prevent it happening again
This is both useful for you (in Data) if you’ve been impacted by an upstream data quality issue to explain the impact it had on your work, and for your external stakeholders to feel like their concerns are heard.
Summary
In this post we looked at what an incident management flow for data teams can look like. While there’s no one-size-fits-all solution to managing incidents, we hope that this article will give you some inspiration you can build into your workflow. In summary
- Issue detection: Use a combination of manually defined tests that incorporate your domain knowledge with automated anomaly checks to proactively catch issues
- Incident response: Declare incidents early and often, be deliberate about how you assess severity, who has what role in the incident and how you communicate progress
- Root cause analysis: With your existing toolset you can navigate data error messages, upstream dependencies, recent code changes and time travel to more quickly assess the root cause
- Resolution: Close the incident out, let impacted stakeholders know and implement learnings to avoid the same issue from happening again
- Learnings: For more severe incidents, a post mortem can be helpful, and will typically have a document with a summary of the incident itself, to discuss what happened and how it could be prevented in future

.png)
.png)