Building reliable machine learning models in the data warehouse

If you work in a data team and haven’t heard your C-suite ask, “could this be done with AI…” it’s probably a matter of time. According to a survey by MIT Technology Review, 81% of executives believe that AI will be a major competitive advantage for their business, and data teams now have clear ROI stories to show.
When we speak with data-forward companies, they’ve meaningfully invested in ML and AI to the extent that it’s now the top priority for the data team.
We’re allocating a $50 million/year ad budget based on automated CLTV predictions from the data warehouse
A significant enabler for this is data warehouse-centric ML systems, democratizing access to large parts of the ML workflow to the wider data team.
In this post, we’ll look into steps you can take to ensure the reliability of your data warehouse-centric ML systems.
Data warehouse-centric machine learning systems
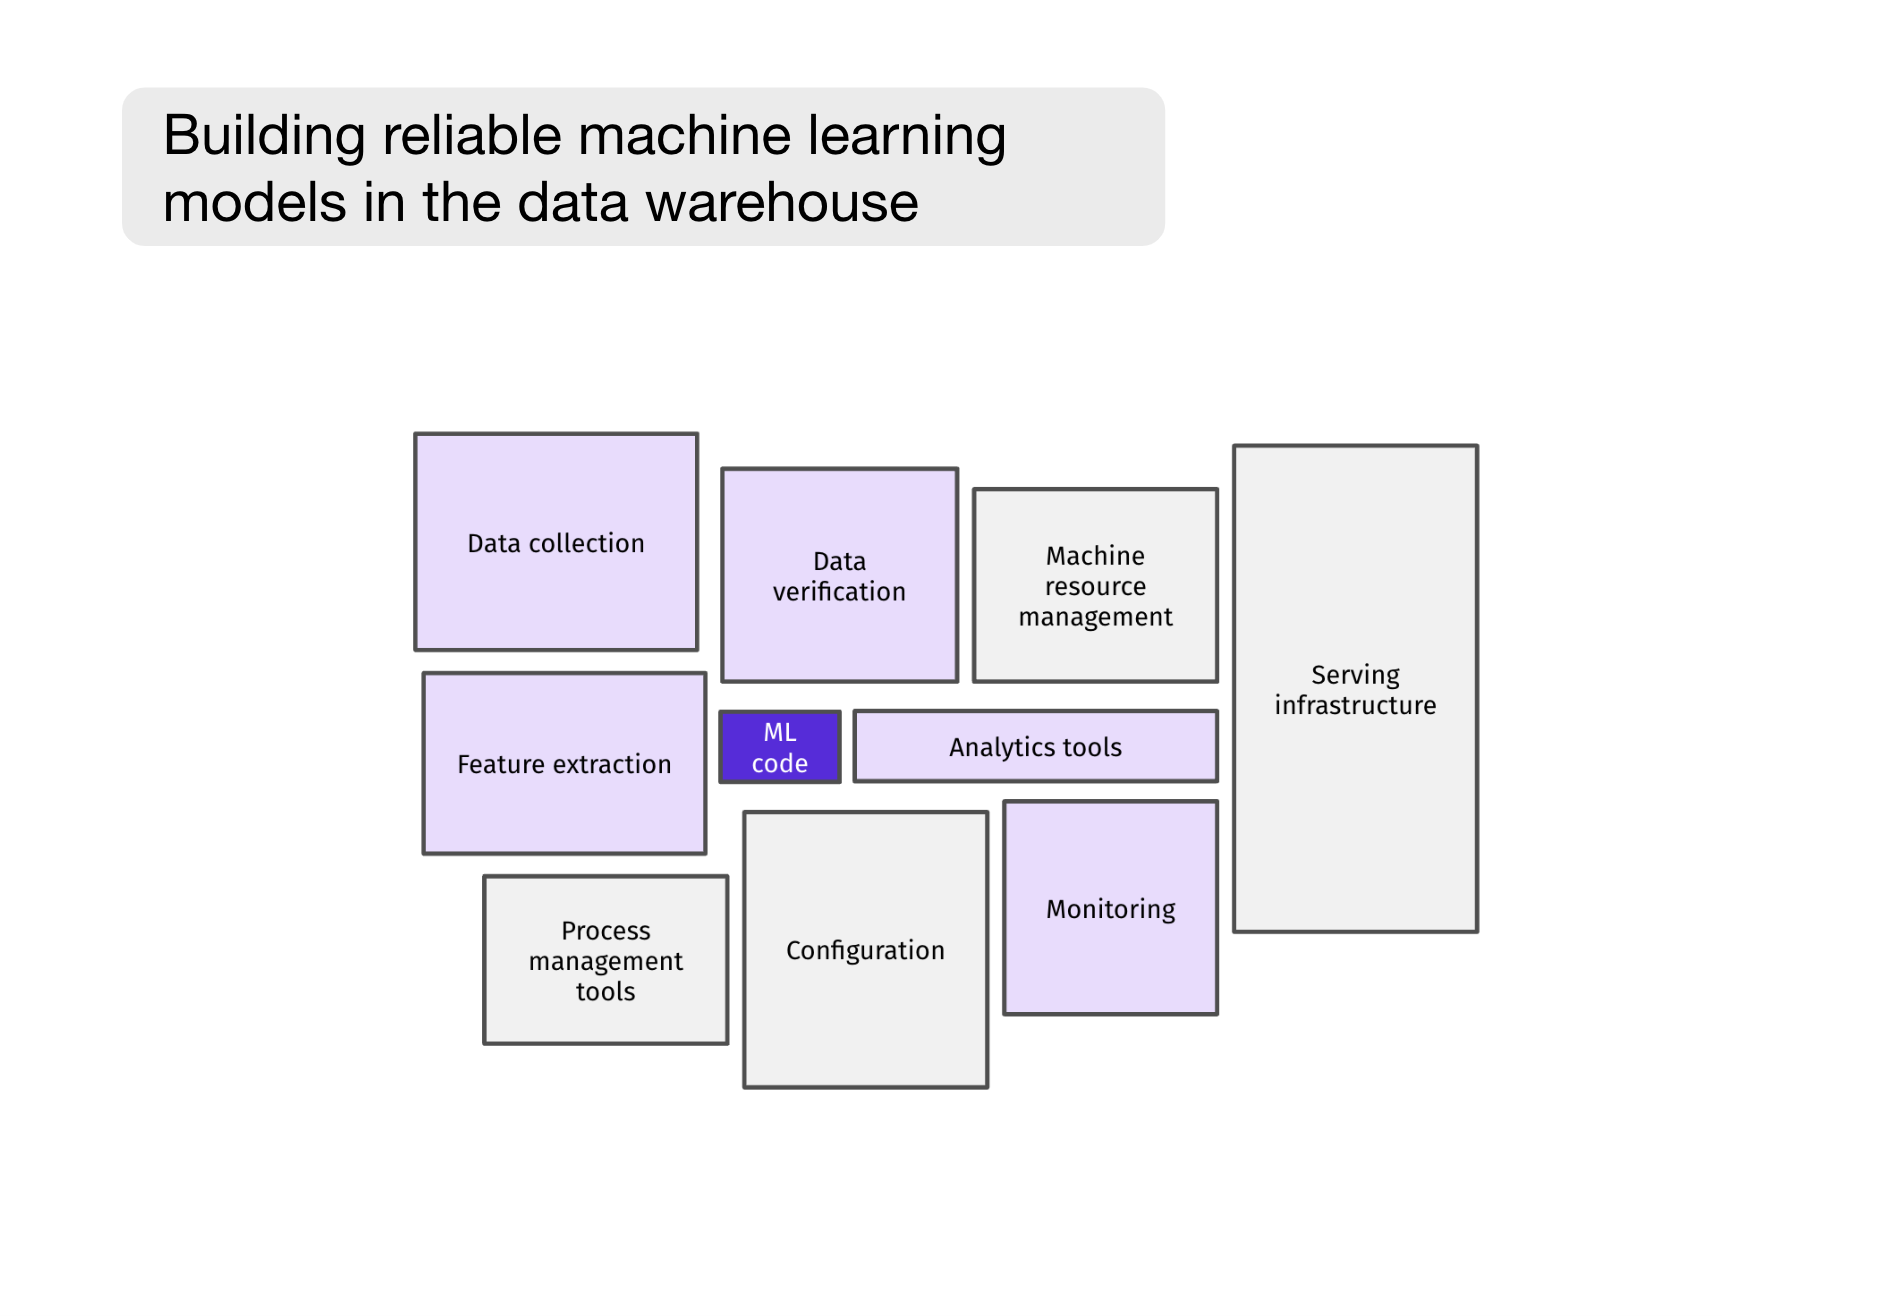
To the great scare of aspiring data scientists, Google shared the now infamous picture showing that ML code is only 5% of the work of a production ML system. In other words, most ML-related work is less glamorous and falls under (a) data collection and feature extraction or (b) resource management, configuration, and serving infrastructure.
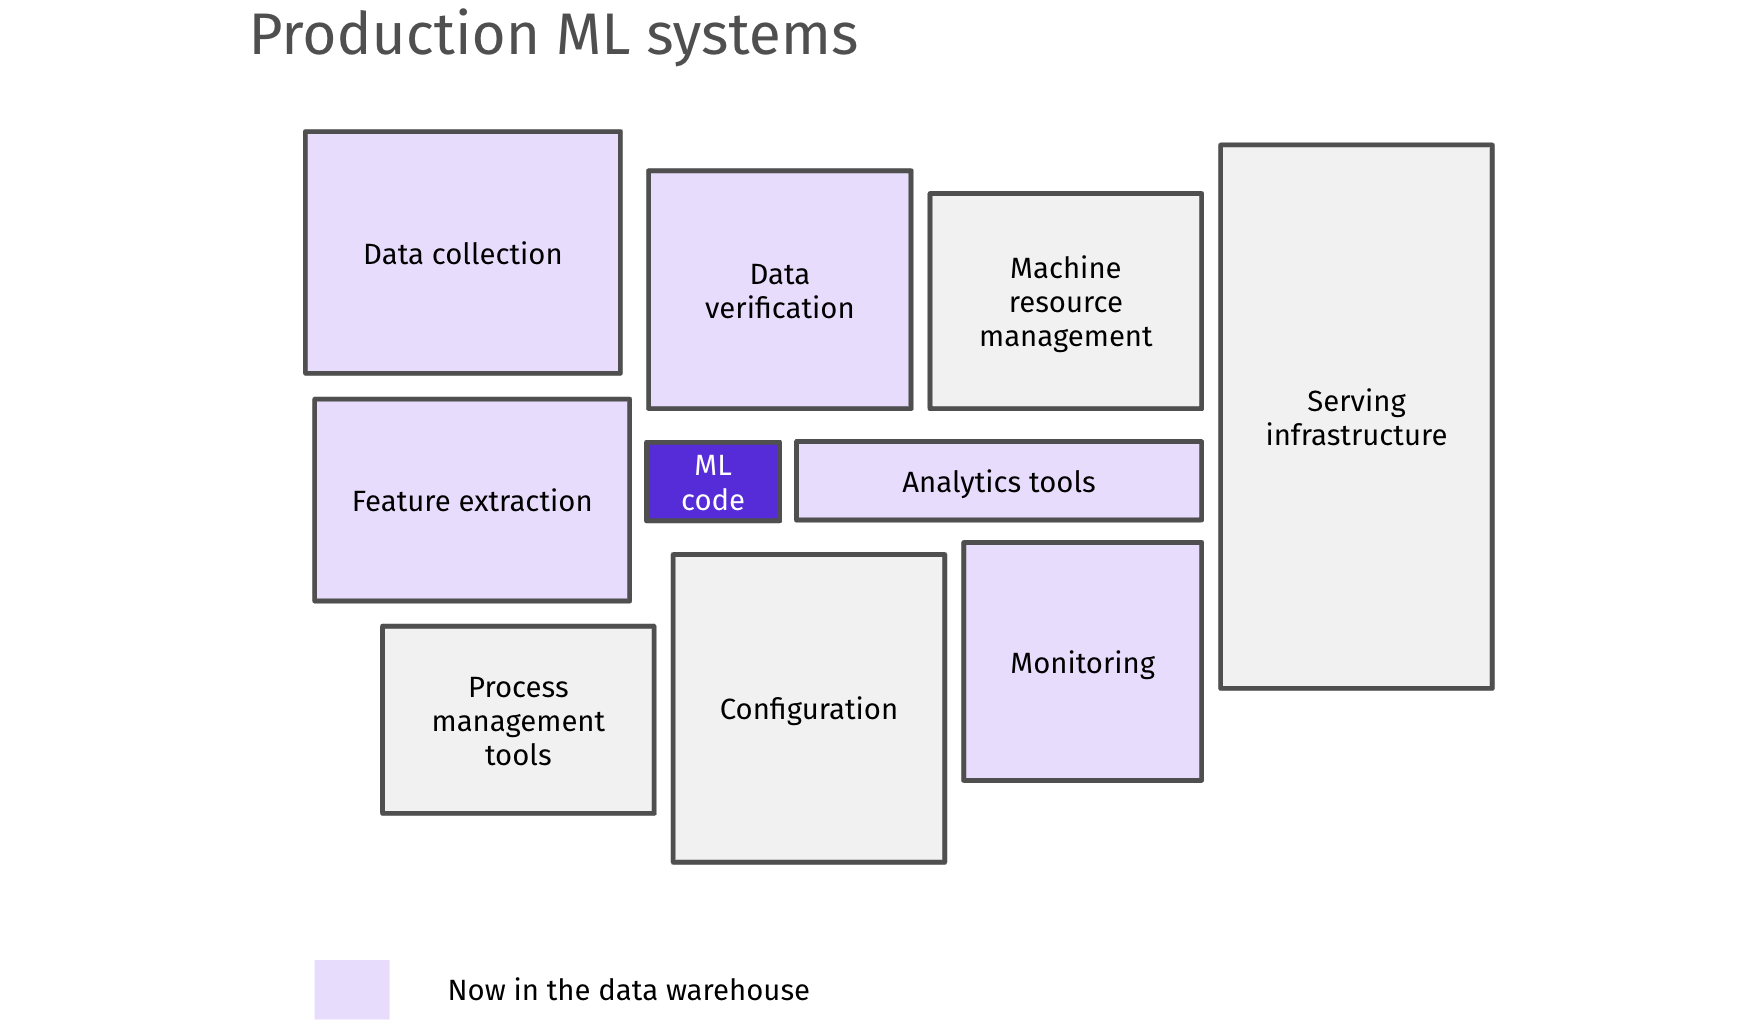
But with data warehouse-centric machine learning systems, this paradigm is now starting to change. Most data collection and feature extraction steps are centralized in the data warehouse, and serving, monitoring, and configuration are also widely simplified. This means that a single data scientist, in some cases, can now manage entire production-grade ML systems.
With major data warehouses integrating this directly in their offering (e.g., BigQuery ML), end-end ML workflows can be moved entirely to the data warehouse.
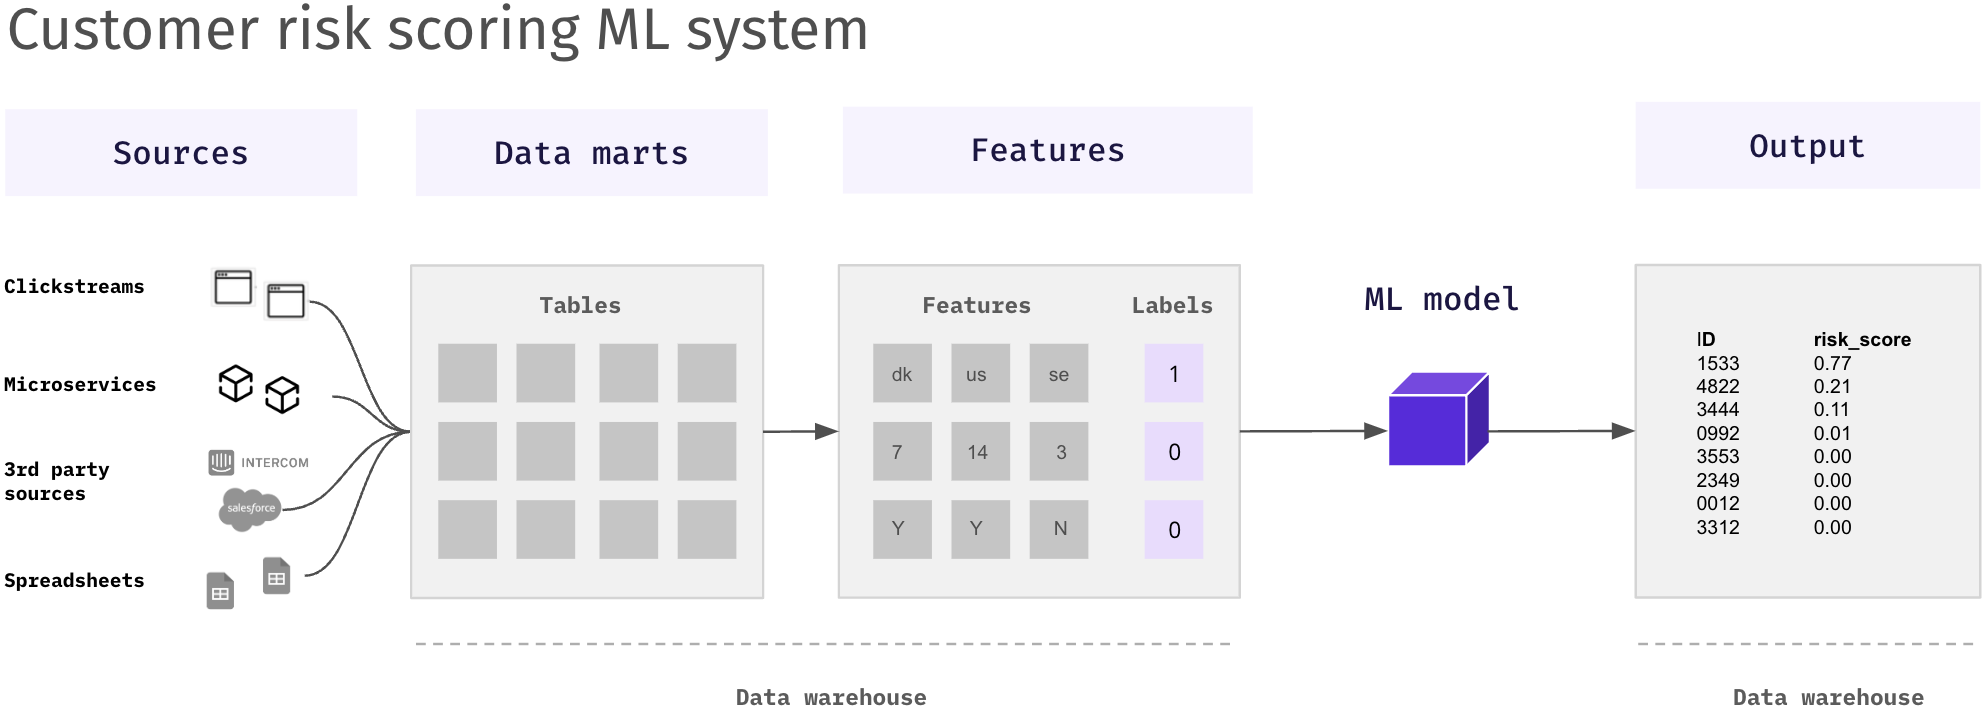
The data warehouse-centric ML system below highlights a customer risk scoring model, predicting how likely it is that new sign-ups are risky customers and should be rejected.
There are several benefits to moving large parts of the ML workflow to the data warehouse.
- Empower data analysts, the primary data warehouse users, to partake in the machine learning model workflow.
- A large part of the preprocessing steps is done using SQL—a language familiar to all data practitioners.
- Increases the speed of model development and innovation by removing the need to move data from the data warehouse and using existing data models.
Moving machine learning systems to the data warehouse also increases the need for reliability. Data teams will manage the reliability of large parts of the systems.
Dimensions of quality in machine learning systems
Machine learning systems are only as good as the sum of their parts. The most critical components to monitor are (1) the data, (2) the model, and (3) the code & deployment.
The data: Models depend on the data received as input both from raw sources and from feature preprocessing. If a model receives an inaccurate or unexpected input, the model may break or create inaccurate generalizations. The input feature distribution may also change over time (data drift), which can cause key assumptions to no longer be true.
The model: At the heart of an ML system is the model. For the model to drive business value, it must exceed a certain performance level. This is often tracked based on key performance metrics such as accuracy, precision, recall, and F1 score, depending on the nature of your problem.
The code & deployment: Code is required to build core components of the machine learning model, serve it to production, and deliver consistent, reliable predictions. This also requires monitoring resource consumption, including CPU, memory, and GPU usage.
While issues can occur in all three areas, data-related issues are the most difficult to detect and guardrail against and the most common cause of model issues.
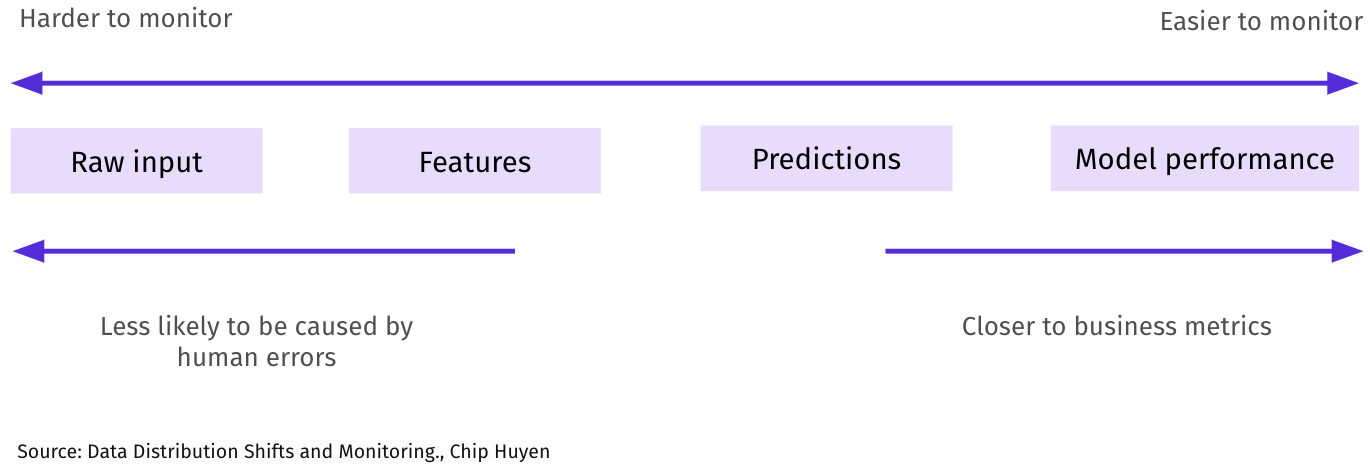
There have been many articles written about how to monitor the model’s performance. With just a few metrics, data scientists have a good level of visibility to check model performance and if it decays over time.
In the rest of this article, we focus on the harder-to-detect data issues: upstream, in the model features, or in the predicted output.
Common data issues
It’s helpful to distinguish between data quality-related issues and data drift–changes in the statistical distribution of key input data.
Examples of data quality issues
- Missing data: Incomplete or missing values in the dataset can impact the model’s ability to generalize and make accurate predictions.
- Inconsistent data: Variability in data formats, units, or representations across different sources or over time can introduce inconsistencies, leading to confusion and errors during model training and inference.
- Outliers: Anomalies or outliers in the data, significantly different from most observations, can influence model training and result in biased or inaccurate predictions.
- Duplicate records: Duplicate entries in the dataset can skew the model’s learning process and lead to overfitting, where the model performs well on training data but poorly on new, unseen data.
Examples of data drift
- Seasonal product preferences: Shifts in customer preferences during different seasons impacting e-commerce recommendations.
- Financial market changes: Sudden fluctuations in the market due to economic events impacting stock price prediction models.
Monitoring data quality
Sources and input data
It’s not uncommon for features to depend on dozens of sources and hundreds of intermediate data transformations, which makes it difficult to manually detect if some data is stale, corrupt, or missing. The impact of stale or missing upstream is particularly problematic when you miss important features at inference–e.g., a transaction being incorrectly classified as low risk because the latest risk score data for the customer was not updated.
“Our Salesforce data was not being imported for new customer sign-ups for two days, causing us to inaccurately predict new signup customers who had been in touch with us before as low potential” - B2C scaleup
Catching issues as far upstream as possible helps prevent them from propagating downstream to key tables, speeds up debugging cycles, and allows you to isolate issues and make the appropriate owner aware more directly.
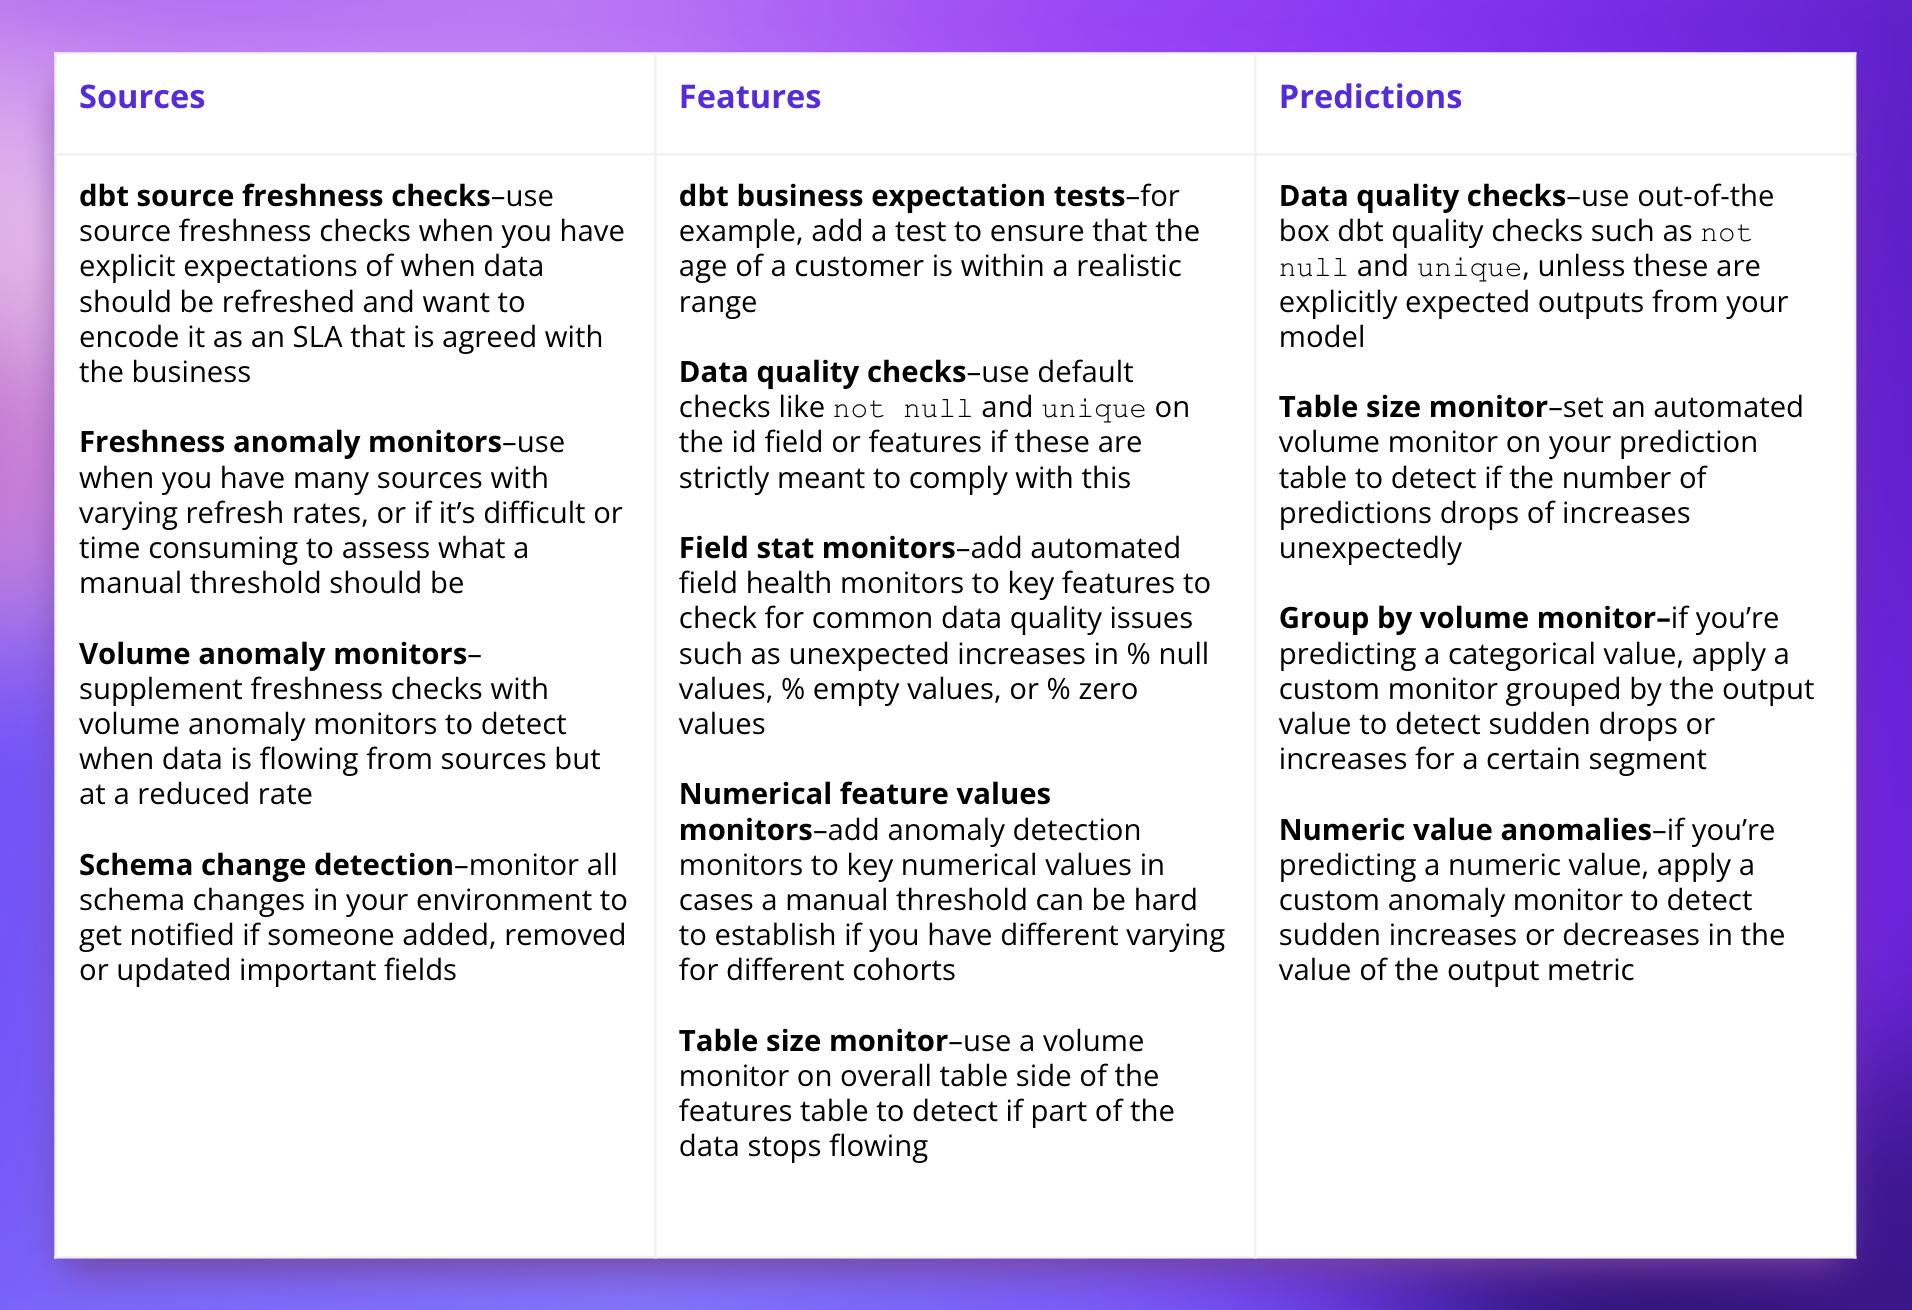
dbt source freshness checks: Source freshness checks snapshot the “freshness” of your source data and receive warning and error messages when your data’s freshness falls below your expectations. We recommend you use source freshness checks when you have explicit expectations of when data should be refreshed and want to encode it as an SLA that is agreed with the business.
Freshness anomaly monitors: A data observability tool can automatically pull data such as information_schema last modified dates for warehouses such as Snowflake and BigQuery and learns the expected refresh patterns of your data to detect when your data starts arriving later than usual. We recommend this when you have many sources with varying refresh rates or if it’s difficult or time-consuming to assess a manual threshold.
Volume anomaly monitors: While freshness checks are good at catching if no new data arrives, you should supplement this with volume anomaly monitors to detect when data is flowing from sources but at a reduced rate–e.g., 80% of clickstream events missing following a change to the event tracking logic.
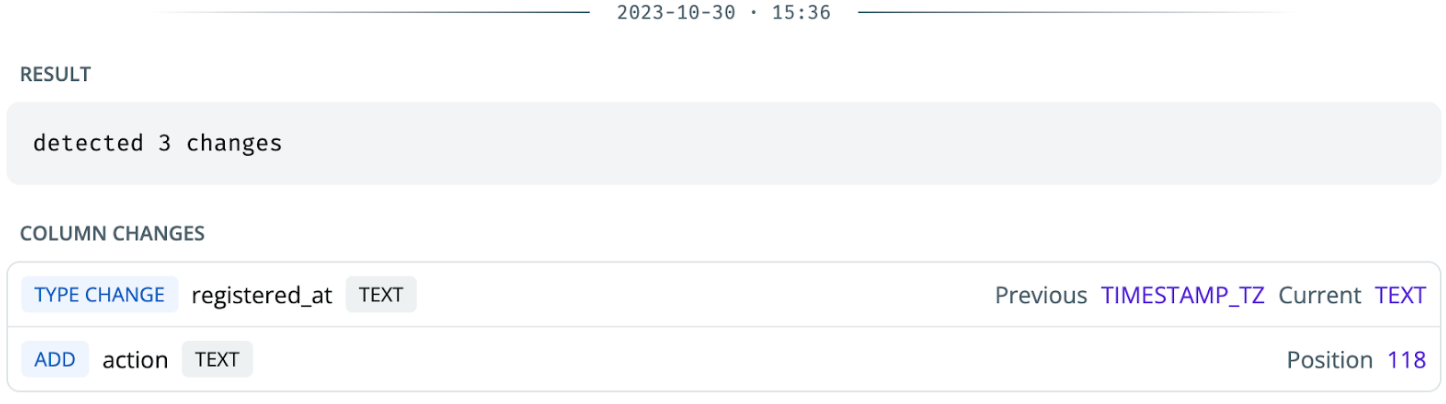
Schema change detection: A data observability tool can help monitor all schema changes in your environment and alert you of added, removed, or updated fields.
Being notified of a column type change from timestamp to text in Synq
Features
Features are included based on the assumption of their ability to predict the outcome you’re trying to predict. They’re prone to upstream errors and issues introduced through preprocessing steps–e.g., a logical error when converting longitude and latitude data points to distance from a large city.
Your first resort to detecting potential data issues on features should be to express your expectations as tests in dbt. Add-ons like dbt-expectations have dozens of pre-written macros that can save you from implementing them yourself.
While some expectations can easily be expressed as tests, automated anomaly monitors better catch other potential issues.
Recommendation 1: Use dbt tests to express expectations of your data
Features often have semantic business implications, meaning you can infer tests depending on your domain intuition.
- If a feature belongs to a list of expected values
- Values failing to satisfy a regex expression
- If the min, max, or average values are within an acceptable range
For example, use the expect_column_values_to_be_between test to ensure that the age of a customer is within a realistic range.
tests:
  - dbt_expectations.expect_column_values_to_be_between:
      min_value: 18
      max_value: 110
You should combine this with the standard data quality checks, such as not null and unique on the id field or features, if these are strictly meant to comply with this.
Recommendation 2: Use anomaly monitors to supplement dbt tests
Not all potential issues can easily be expressed as a test. For example, while you may be okay with some null values or empty data for a feature and have preprocessing steps in place for handling this, if the % of null values jumps from 0.1% to 10%, you need to know about this, as it can have a significant impact on the model performance. Hardcoding these as rules for hundreds of features is infeasible and would require constant updating.
We recommend the following anomaly monitors as a minimum.
- Field stat monitors–add automated field health monitors to key features to check for common data quality issues such as unexpected increases in % null values, % empty values, or % zero values.
- Numerical feature values monitor–add anomaly detection monitors to key numerical values in cases where a manual threshold can be hard to establish if you have different varying for different cohorts. For example, you may know that the purchasing price should always be between $1,000 and $10,000, but hardcoding thresholds for each user demographic is not straightforward.
- Table size monitor–use a volume monitor on the overall table side of the features table to detect if part of the data stops flowing. In a tool like Synq, you can set the anomaly monitoring precision to pick up on even very granular changes.
A Synq anomaly monitor detects outliers in the average purchase price for each customer demographic.

Predictions
Predictions are more straightforward to monitor. Predictions are typically just one column–a number (e.g., house price), a boolean (e.g., fraud yes/no), a categorical item (e.g., green/red/yellow), and an associated id (e.g., customer_id). This means you can grasp if something is off with a simple visualization.
However, predictions may be made several times daily, and you may have dozens of ML systems in production. Therefore, it’s easy to miss an important issue if you don’t have sufficient monitoring in place.
We recommend you take these steps to ensure the quality of your predictions.
Note: For some of these recommendations, writing your predictions to a table with a timestamp for historical comparisons of predicted values is a prerequisite.
dbt standard quality tests: Use out-of-the-box dbt quality checks such as not null and unique on the id field and predicted value unless these are explicitly expected outputs from your model.
Volume monitor: Set an automated volume monitor on your prediction table to detect if the number of predictions drops or increases unexpectedly. If predicting a categorical value, apply a custom monitor grouped by the output value to detect sudden drops or increases for a certain segment.
Numeric value anomalies: If you’re predicting a numeric value, apply a custom anomaly monitor to detect sudden increases or decreases in the value of the output metric.
A sharp drop was detected in the average value of customer lifetime predictions.

Identifying data drift
Addressing data drift can sometimes be detected with data quality monitoring but is mostly outside the scope of this article. Shifts in the distribution of your data can be caused by underlying business changes, such as a shift in demographics or spending behavior, meaning that the data the original model was trained on may no longer reflect the reality in which your company operates.
Example of data drift:
“In a credit scoring model trained on historical data, data drift can occur when economic conditions change. For instance, during a recession, the model may misclassify individuals, not adapted to the shifted data distribution, approving loans to riskier customers and rejecting creditworthy ones.”
Feature distributions shift constantly, and most of these changes may not mean that you have a business problem or have any material impact on your model’s performance.
It’s helpful to consider feature drift as a key consideration to explain degrading model performance and when deciding how often and in what time frame to retrain a model. To supplement manual analysis, there are tools such as Evidently specialized in automatically detecting data drift.
Other considerations
As you may have dozens of models in production, hundreds of upstream sources, and thousands of features, granular monitoring of all of these hourly is often not feasible. It may lead to alert fatigue and add a non-trivial cost to data processing.
You should pay attention to where checks are needed most and how often they should be run. For example, if you only retrain your model once a month, you may not need hourly monitoring of the training data. But suppose you run inference to get new predictions every day and use these to inform Google about the customer lifetime value of a user to adjust ad-bidding automatically. In that case, you’ll want to know about issues right away.
Summary
In this post, we’ve looked into the rise of data warehouse-centric machine learning systems, with a focus on how to ensure the reliability of sources, features, and predictions.
- Benefits of data warehouse-centric ML systems: Most steps around building and deploying ML models are drastically simplified when the warehouse is at the center. This enables everyone in the data team to participate.
- Data teams as owners of ML system reliability: With ML systems moving to the warehouse, it increases the need for data teams to be equipped to monitor reliability. The key monitoring components are the data, the model, and the code & configuration. The data is often the most difficult to monitor.
- Monitoring data quality for sources, features, and predictions: By combining quality and business assertion tests with anomaly monitors, you can proactively detect data quality issues before they impact model performance or make incorrect predictions.
- Other considerations: Be mindful of how often you run data quality checks and where they are most needed to reduce alert fatigue and avoid costs spiraling out of control.

.png)
.png)