How to identify your business-critical data

This article has been co-written with Lindsay Murphy from Secoda
Not all data is created equal. If you work in a data team you know that if a certain dashboard breaks you drop everything and jump on it, whereas other issues can wait until the end of the week. There’s a good reason for this. The first may mean that your entire company is missing data whereas the former may have no significant impact.
However, keeping track of all your business-critical data as you scale your team and grow the number of data models and dashboards can be difficult. This is why situations such as these ones happen
“I had no idea finance was relying on this dashboard for their monthly audit report”
or
“What the heck, did our CEO bookmark this dashboard that I made in a rush as a one-off request six months ago”
In this article we’ll look into
- Why you should identify your critical data assets
- How to identify critical dashboards and data models
- Creating a culture of uptime for critical data
Why you should identify your business-critical data
When you have mapped out your business-critical assets you can have an end-end overview across your stack that shows which data models or dashboards are business-critical, where they are used, and what their latest status is.
This can be really useful, in a number of different ways
- It can become an important piece of documentation that helps drive alignment across the business on the most important data assets
- It breeds confidence in the data team to make changes and updates to existing models or features, without fear of breaking something critical downstream
- It enables better decision making, speed, and prioritisation when issues arise
- It gives your team permission to focus more of your energy on the highly-critical assets, and let some less important things slide

Example of seeing important impacted data models and dashboards for an incident in Synq
In this article we’ll look at how to identify your business-critical data models and dashboards. You can apply most of the same principles to other types of data assets that may be critical to your business.
What data is business-critical
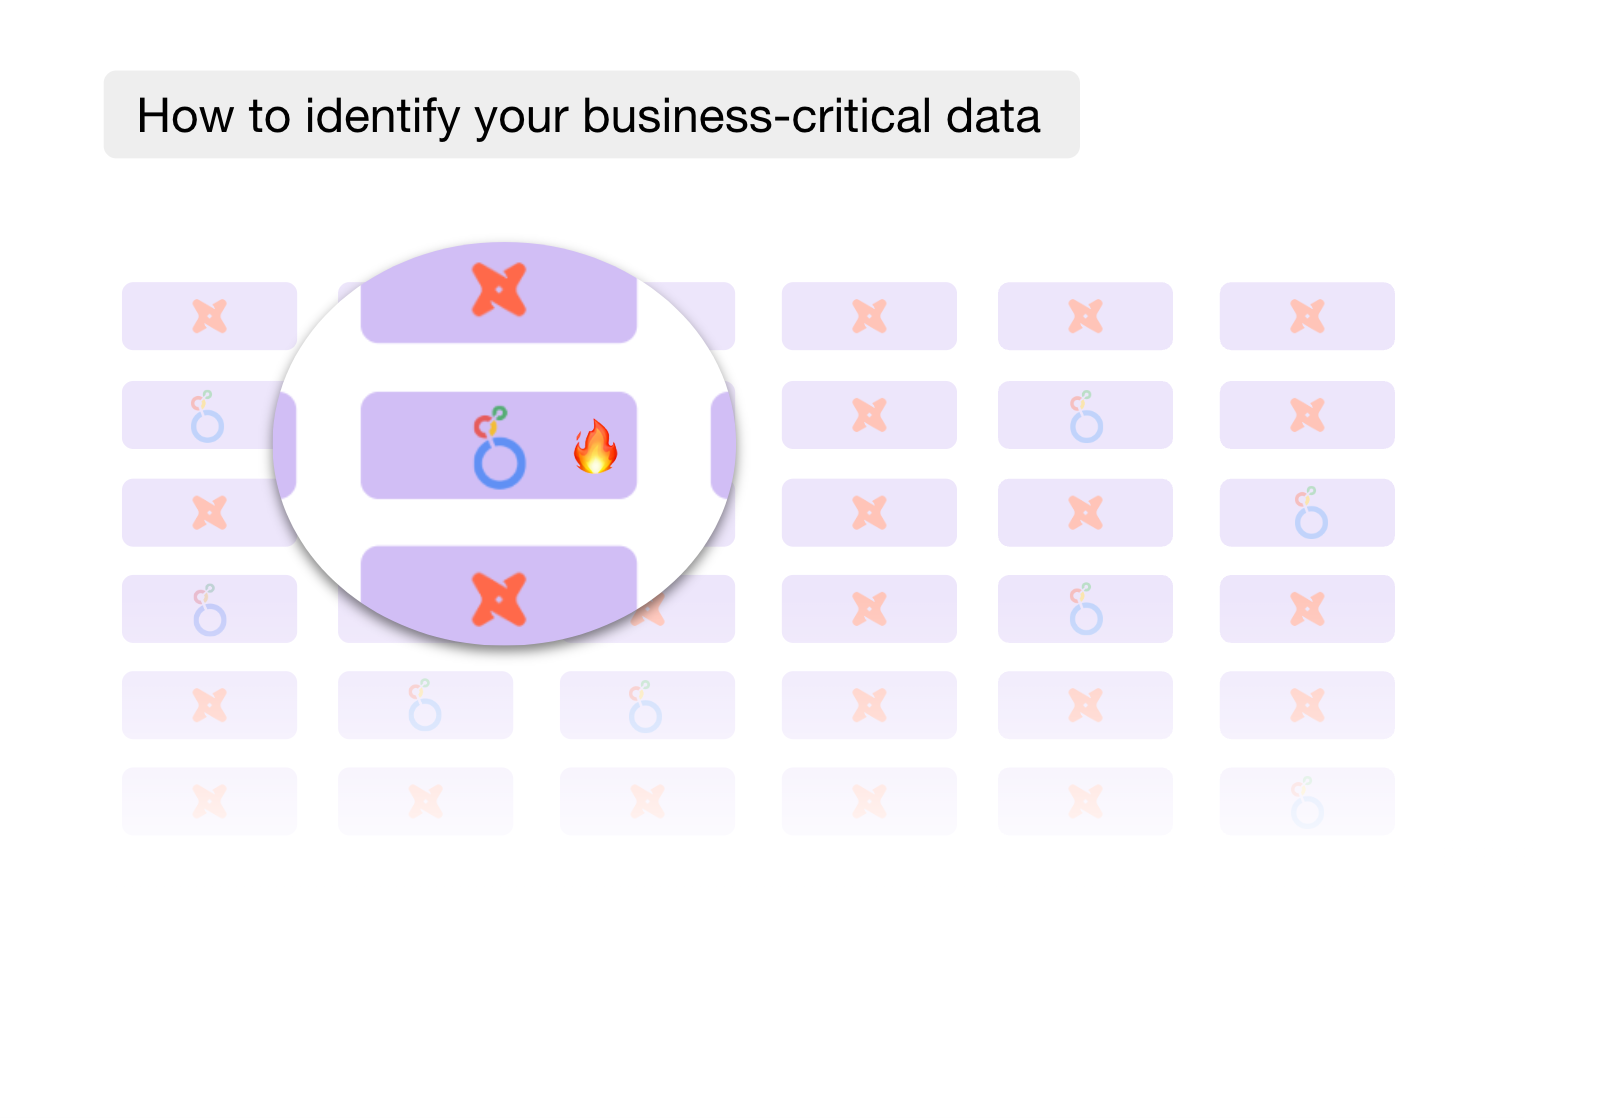
Data used for decision-making is important and if data is incorrect it may lead to wrong decisions and over time a loss of trust in data. But data-forward businesses have data that is truly business-critical. If this data is wrong or stale you have a hair-on-fire moment and there is an immediate business impact if you don’t fix it such as
- Tens of thousands of customers may get the wrong email as the reverse ETL tool is reading from a stale data model
- You’re reporting incorrect data to regulators and your C-suite can be held personally liable
- Your forecasting model is not running and hundreds of employees in customer support can’t get their next shift schedules before the holidays

Mapping out these use cases requires you to have a deep understanding of how your company works, what’s most important to your stakeholders and what potential implications of issues are.
Identifying your business-critical dashboards
Looker exposes metadata about content usage in pre-built Explores that you can enrich with your own data to make it more useful. In the following examples, we’ll be using Looker, but most modern BI tools enable usage-based reporting in some form (Lightdash also has built in Usage Analytics, Tableau Cloud offers Admin Insights, and Mode’s Discovery Database offers access to usage data, just to name a few).
Importance based on business-critical use case
When you speak with your business leaders you can ask questions such as
- What are your top priorities for the next three months
- How do you measure success for your area
- What are the most critical issues you’ve had in the past year
Your business leaders may not know that the reason why average customer support response times jumped from two hours to 24 hours over Christmas was due to a forecasting error from stale upstream data, but they’ll describe the painful experience to you. If you can map out the most critical operations and workflows and understand how data is used you’ll start uncovering the truly business-critical data.
Importance based on dashboard usage
The most obvious important dashboards are ones that everyone in the company uses. Most of these you may already be aware of such as “Company wide KPIs”, “Product usage dashboards”, or “Customer service metrics”. But you’ll sometimes be surprised to discover that dozens of people are relying on dashboards you had no idea existed.
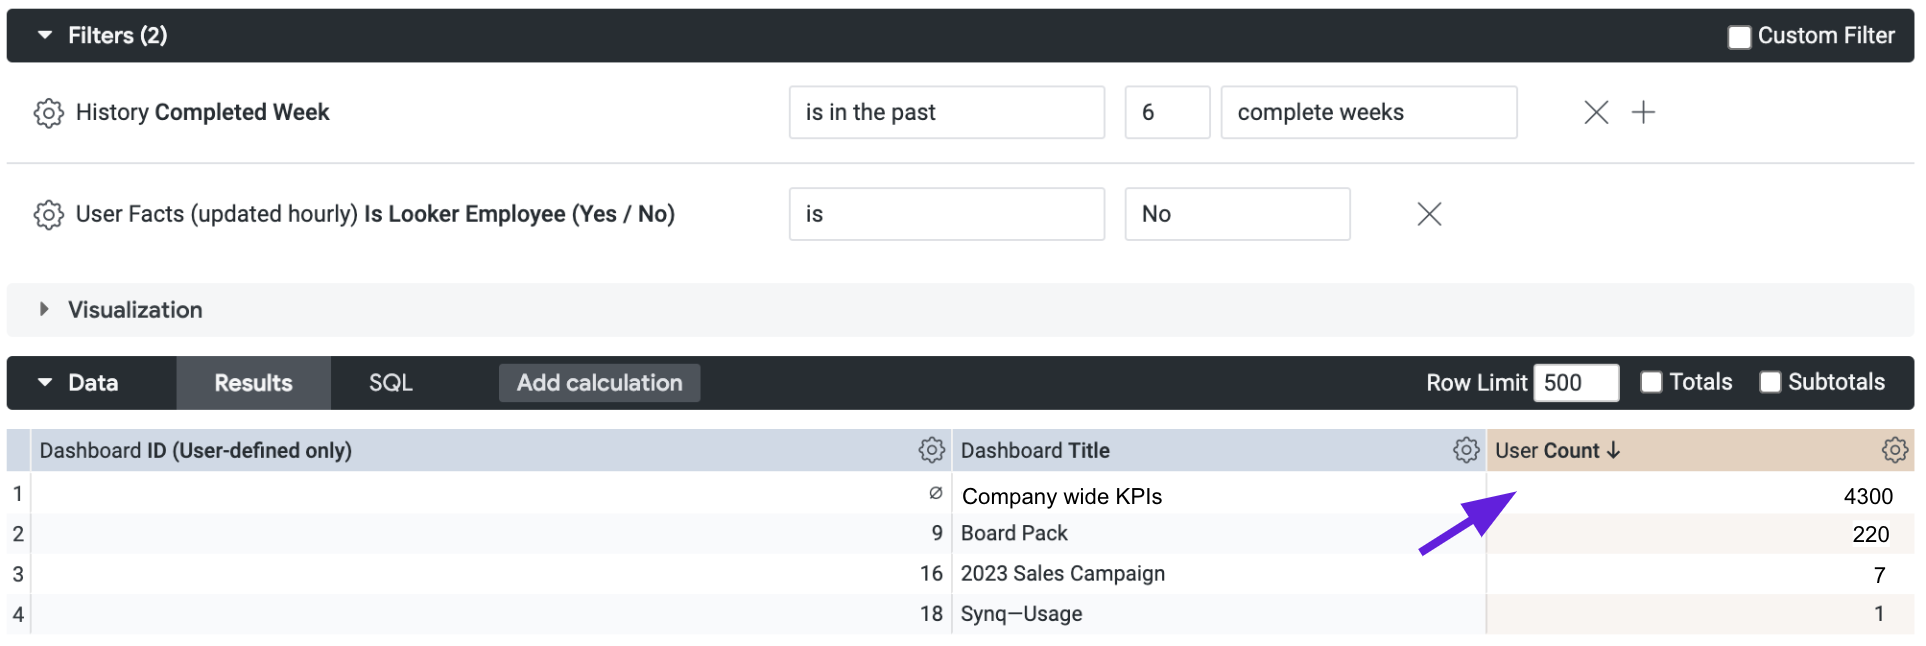
In most cases you should filter for recent usage to not include dashboards that had a lot of users six months ago but no usage in the last month. There are exceptions to this such as a quarterly OKR dashboard that’s only used every three months.
Importance based on dashboard C-suite usage
Like it or not, if your CEO uses a dashboard regularly it’s important, even if there’s only a handful of other users. In the worst case scenario you realise that a member of the C-suite has been using a dashboard for months with incorrect data without you having any idea this dashboard existed.
”We discovered that our CEO was religiously looking at a daily email delivered with a report on revenue, but it was incorrectly filtered to include a specific segment, so it didn’t match the centralised company KPI dashboard.” - Canadian healthcare startup
If you have an employee system of record, you may be able to easily get identifiers for peoples’ titles and enrich your usage data with this. If not, you can maintain a manual mapping of these and update them when the executive team changes.
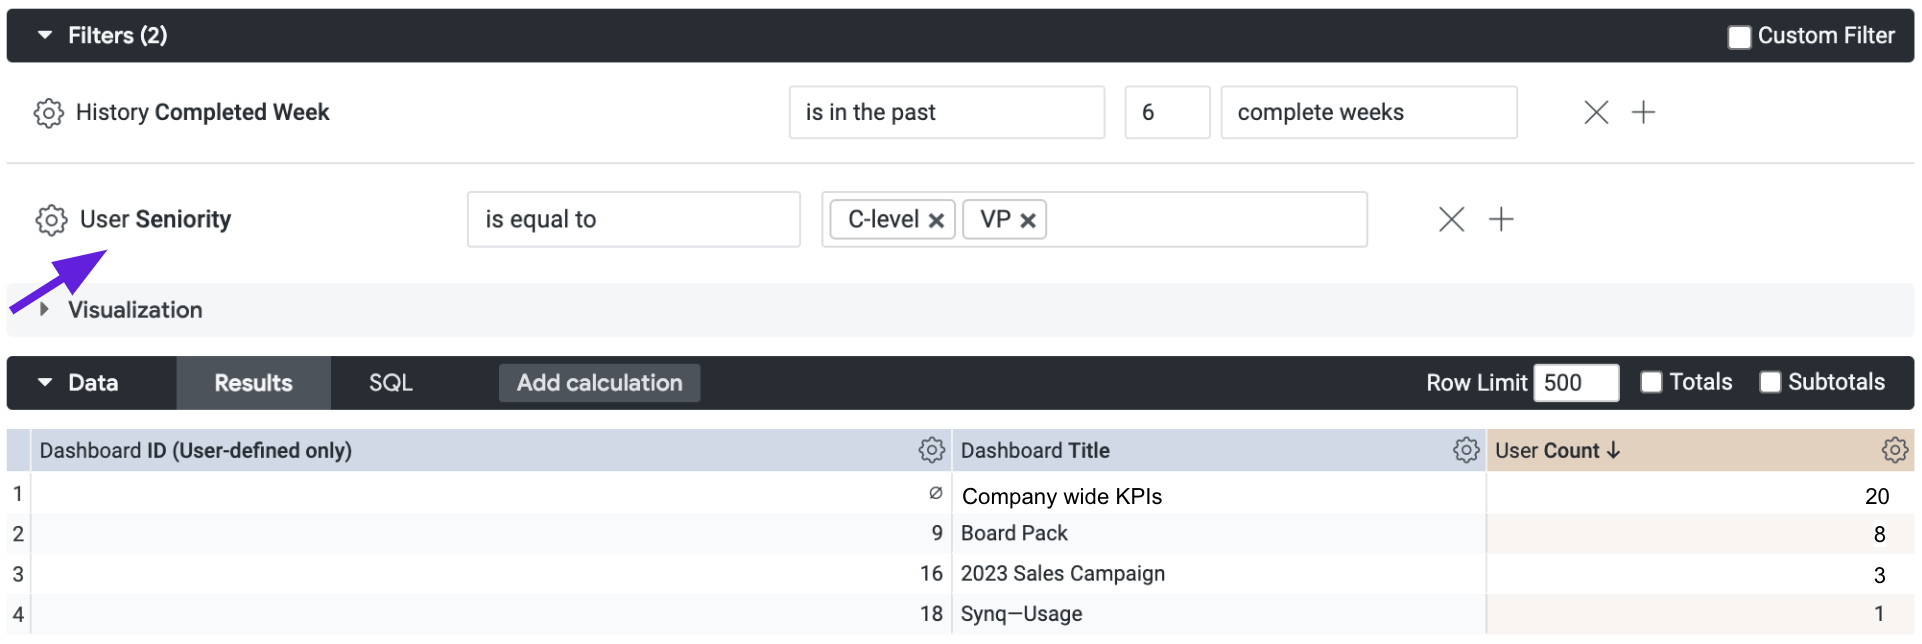
While usage by seniority is highly correlated with importance, your first priority should be mapping out the business-critical use cases. For example, a larger fintech company has a dashboard used by the Head of Regulatory Reporting to share critical information with regulators. The accuracy of this data can be of higher importance to your CEO than the dashboard they look at every day.
Identifying your business-critical data models
With many dbt projects exceeding hundreds or thousands of data models, it’s important to know which ones are business-critical so you know when you should prioritise a run or test failure, or build extra robust tests.
Data models with many downstream dependencies
You likely have a set of data models where if they break everything else is delayed or impacted. These are typically models that everything else depends on such as users, orders or transactions.
You may already know which ones these are. If not, you can also use the manifest.json file that dbt produces as part of the artifacts at each invocation and the depends_on property for each node to loop through all your models and count the total number of models that depend on them.
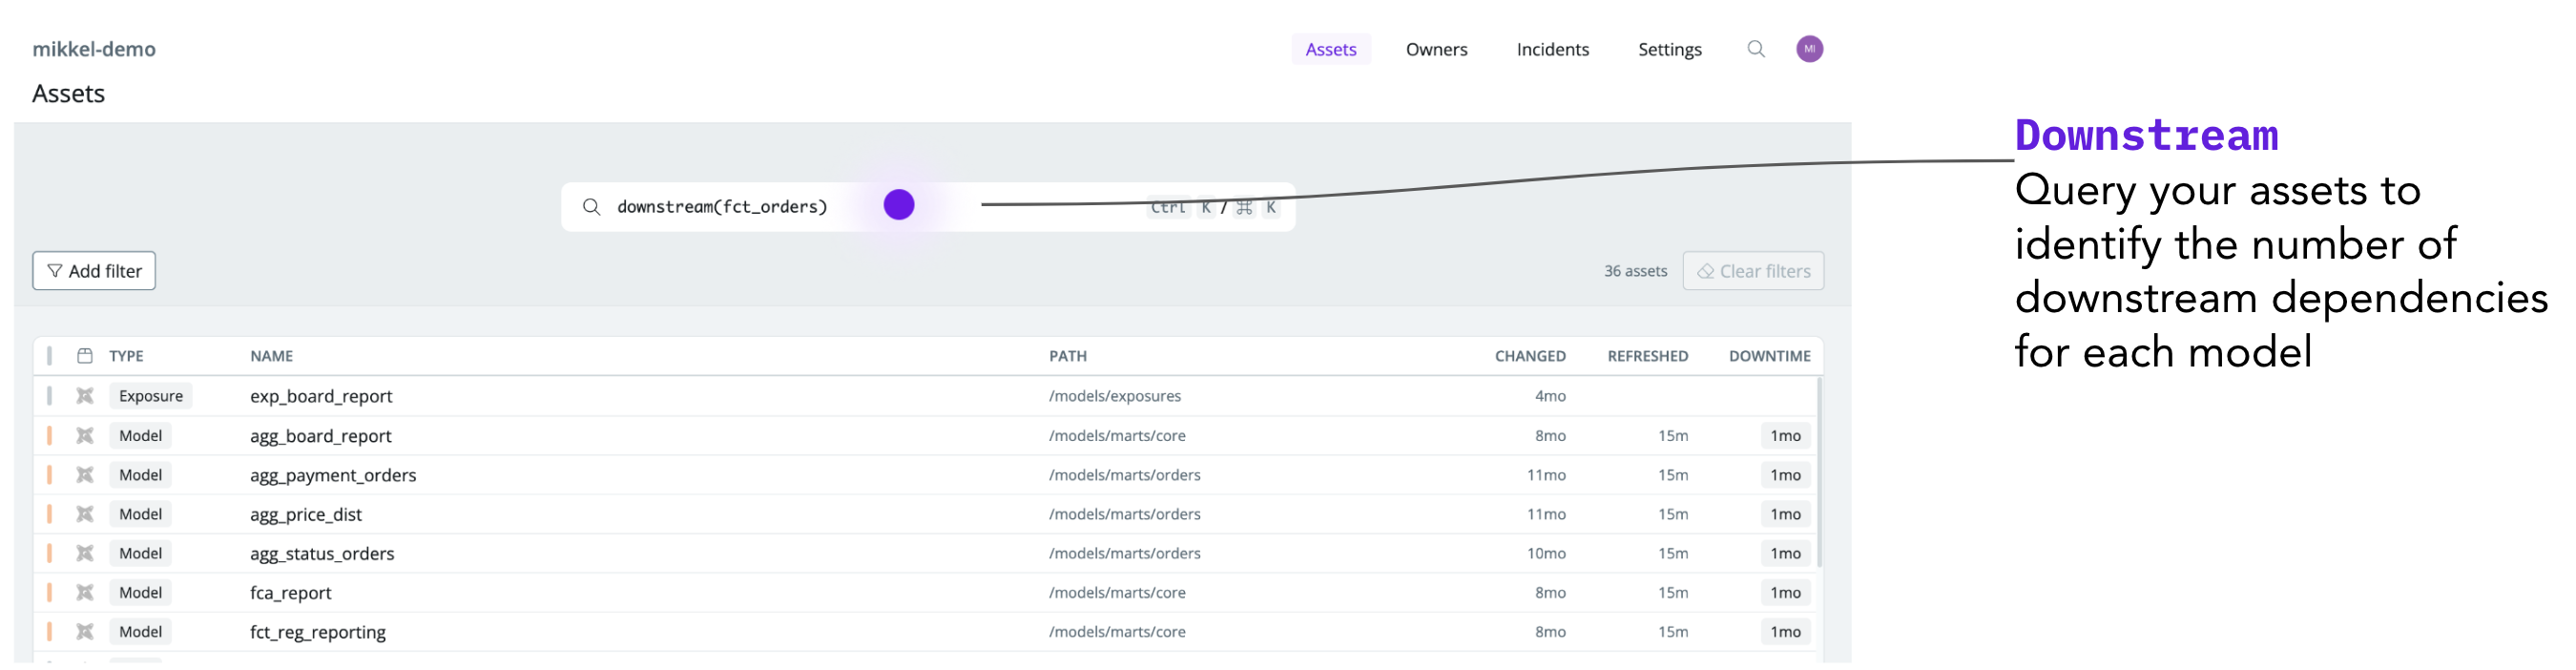
Example of using Synq query to count the number of downstream dependencies for the fct_orders data model
In most cases you’ll find a handful of models with disproportionately many dependencies. These should be marked as critical.
Data models on the critical path
Data models are rarely critical on their own, but most often because of the importance of their downstream dependency, such as an important dashboard or a machine learning model used to serve recommendations to users on your website
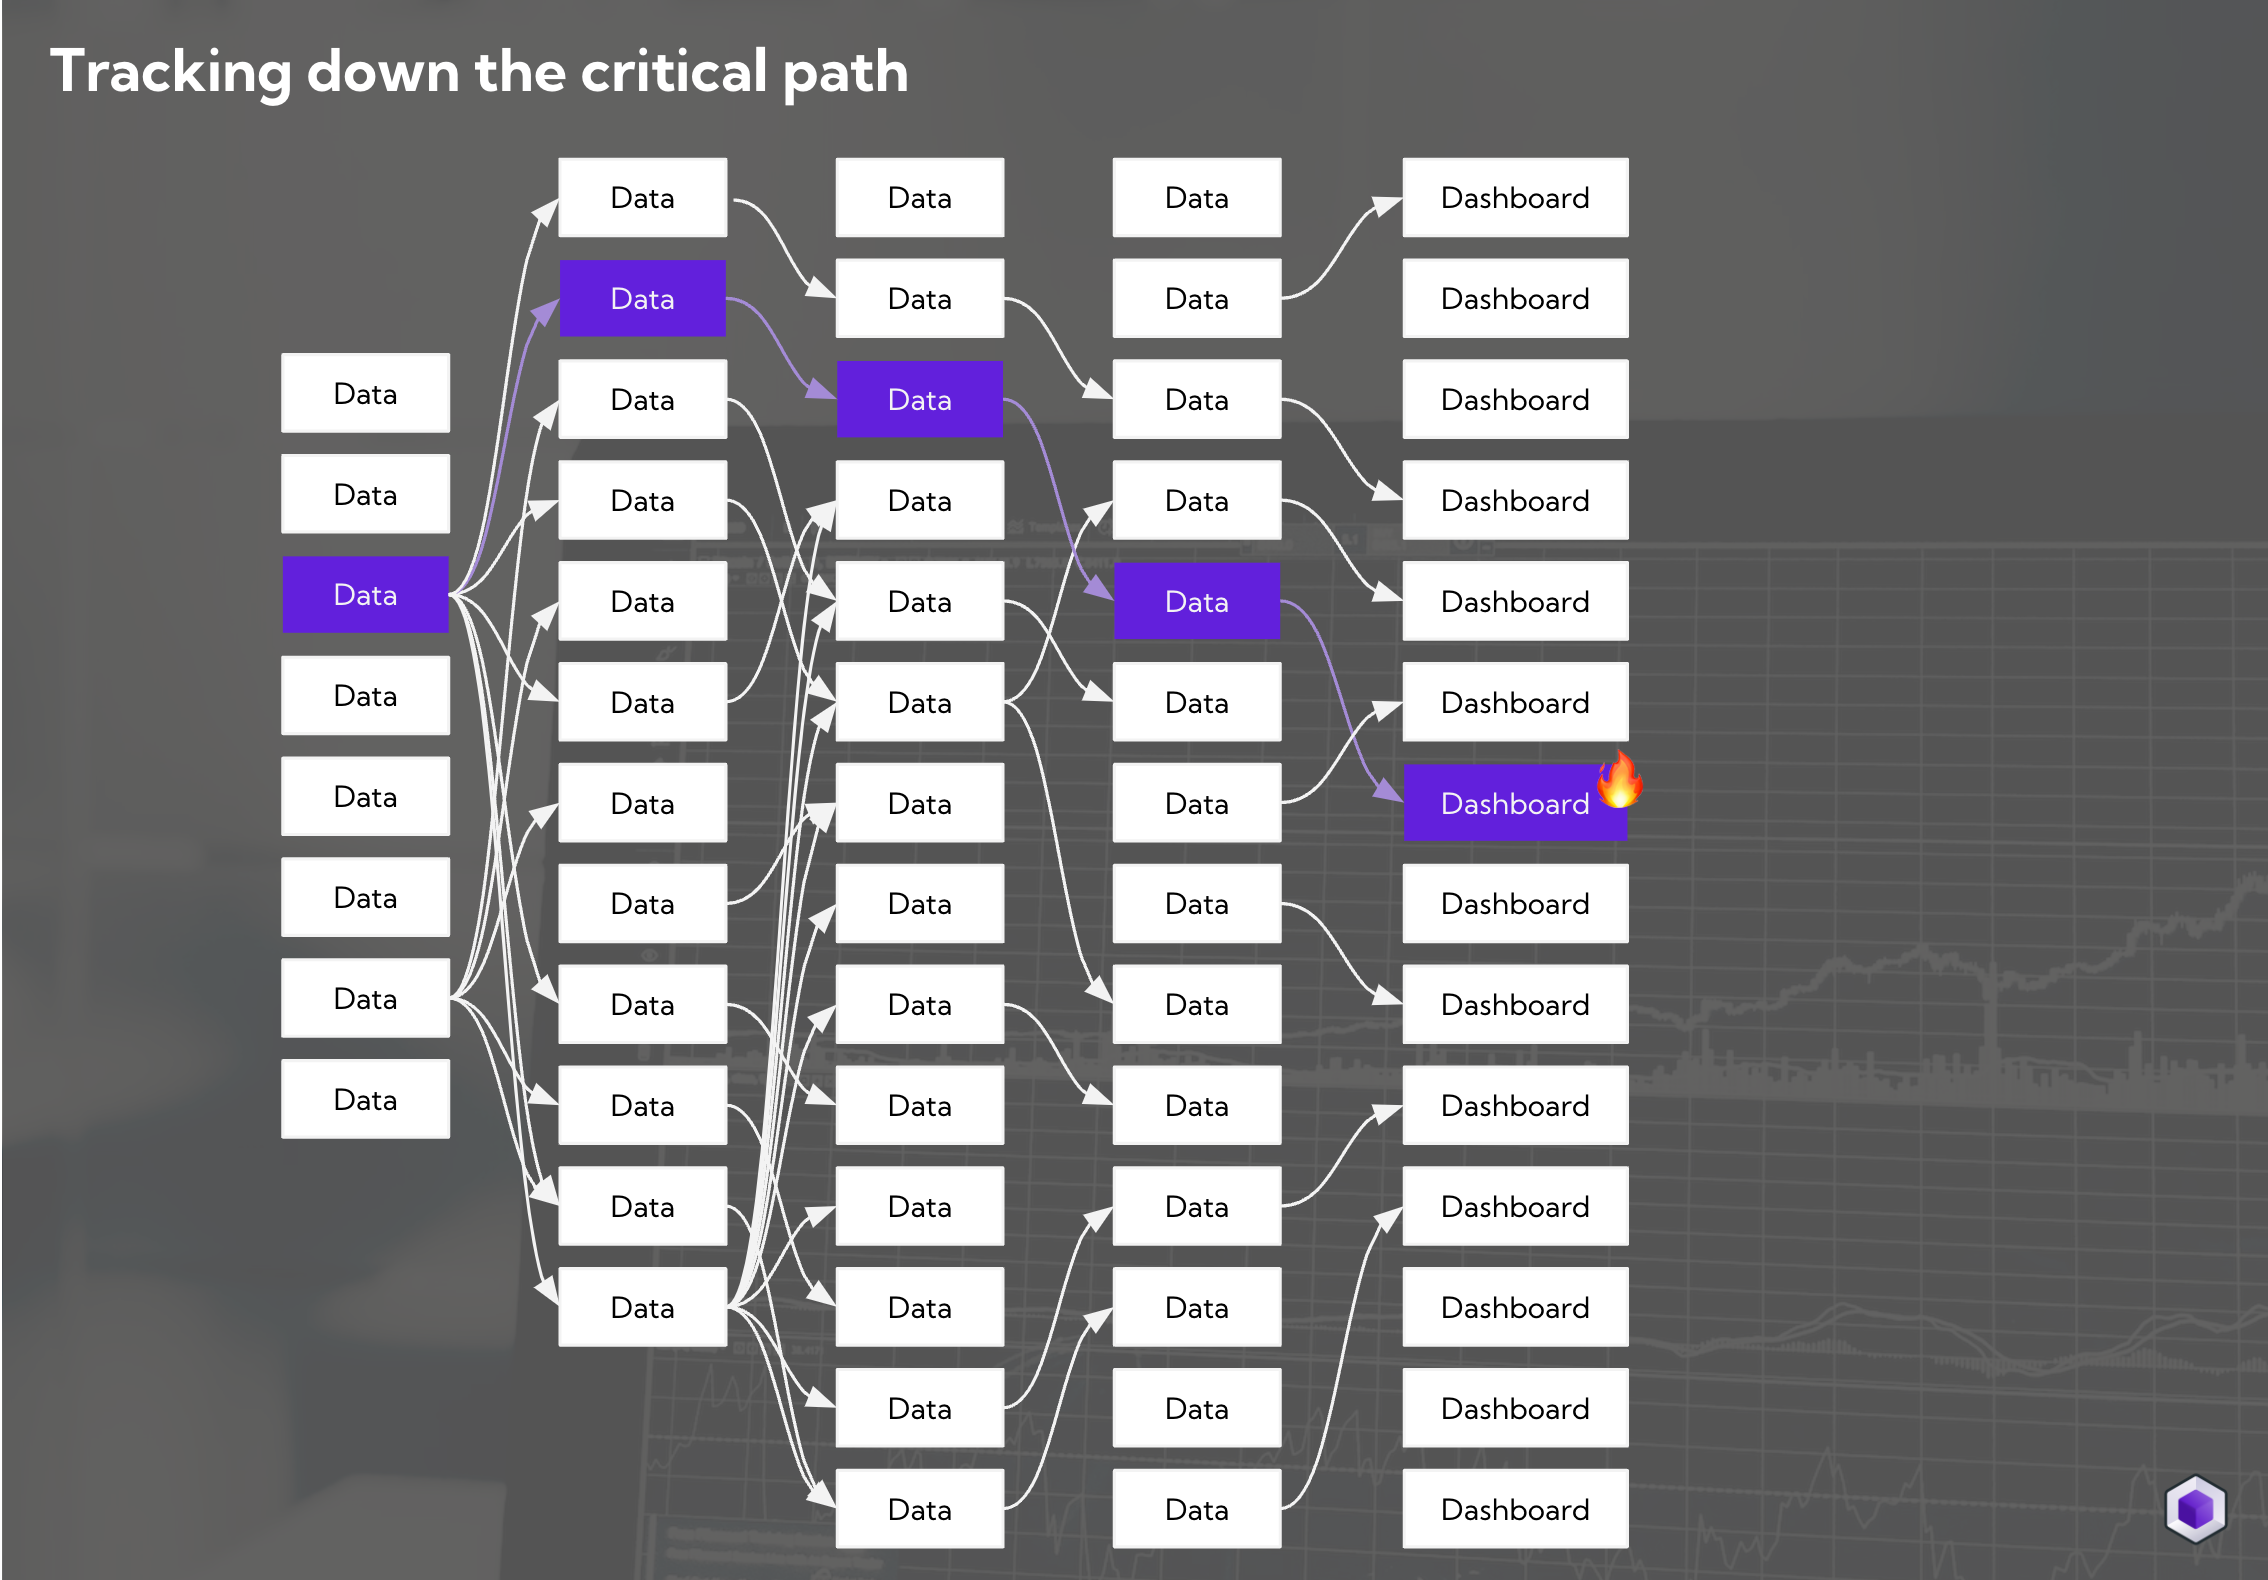
All data models upstream of a business-critical dashboard are on the critical path
Once you’ve gone through the hard work of identifying your business-critical downstream dependencies and use cases you can use exposures in dbt to manually map these or use a tool that automatically connects your lineage across tools.
Anything upstream of a critical asset should be marked as critical or as on the critical path.
How to keep your critical data model definitions updated
Automate as much as possible around tagging your critical data models. For example
- Use check-model-tags from the pre-commit dbt package to enforce that each data model has a criticality tag
- Build a script, or use a tool, that automatically adds a
critical-pathtag to all models that are upstream of a business-critical asset
Defining criticality labels
There’s no one right answer to how to define criticality but you should ask yourself two questions
- What are your plans for how you treat critical data assets differently
- How do you maintain a consistent definition across what’s critical so that everyone is on the same page
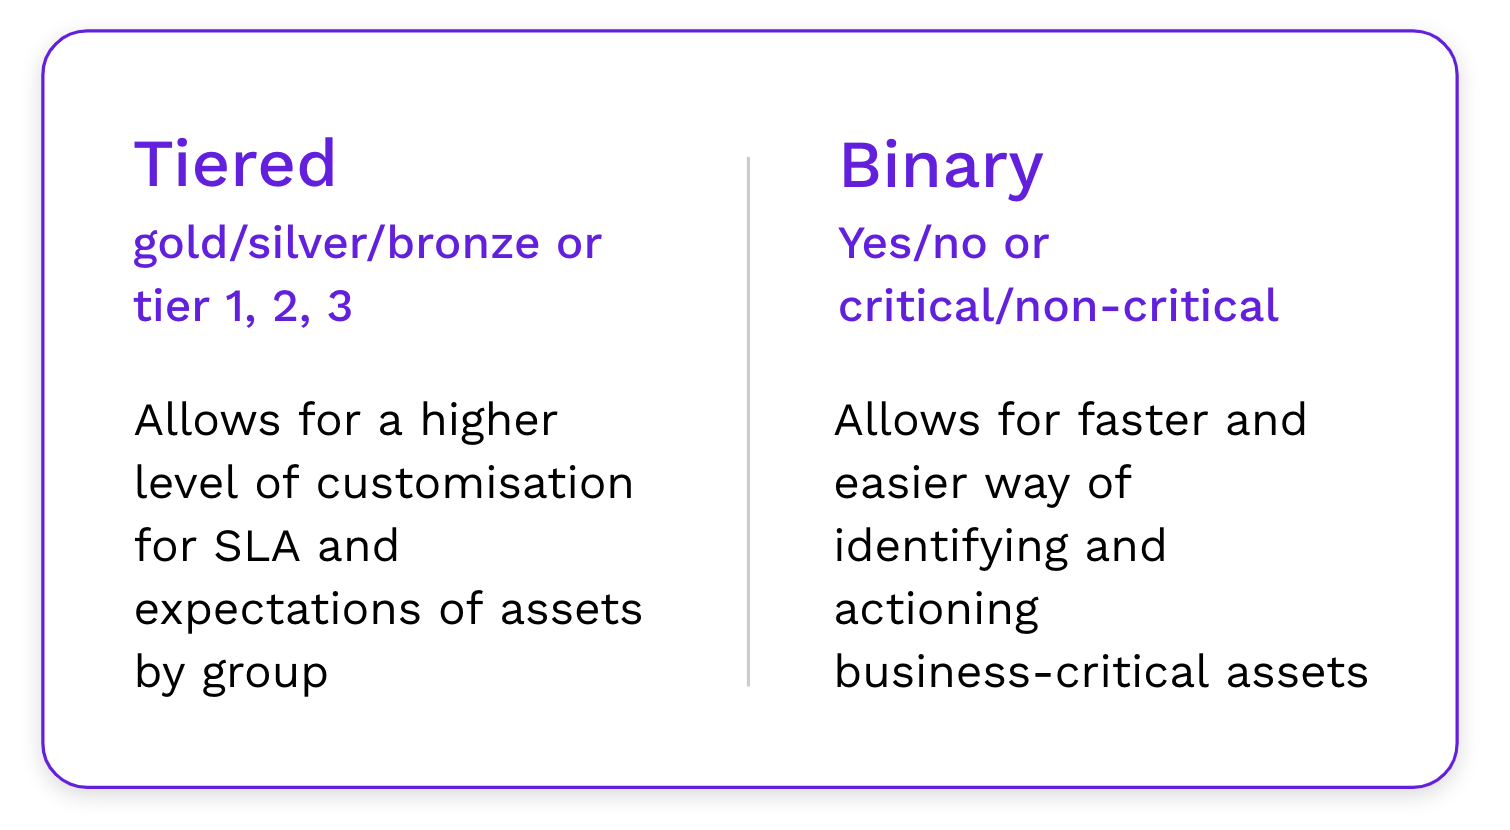
Most companies use a tiered approach (e.g. bronze, silver, gold) or a binary approach (e.g. critical, non-critical). Both options can work and the best solution depends on your situation.
You should be consistent in how you define criticality and write these up as part of your onboarding for new-joiners and avoid postponing this. For example, the definition of tiering could be
- Tier 1: Data model used by a machine learning system to determine which users are allowed to sign up for your product
- Tier 2: Dashboard used by the CMO for the weekly marketing review
- Tier 3: Dashboard used by your product manager to track monthly product engagement
If you’re not consistently updating and tagging your assets it leads to a lack of trust and an assumption that you can’t rely on the definition.
Where to define criticality
There’s no one right place to define criticality but it’s most commonly done either in the tool where you create the data asset, or in a data catalog, such as Secoda.
Defining criticality in the tool where you create the data asset
In dbt you can keep your criticality definitions in your .yml file alongside your data model definition. This has several advantages such as being able to enforce criticality when merging a PR or easily carrying over this information across tools such as a data catalogue or observability tool
models:
 - name: fct_orders
   description: All orders
   meta:
     criticality: high
Example of defining criticality in a .yml file
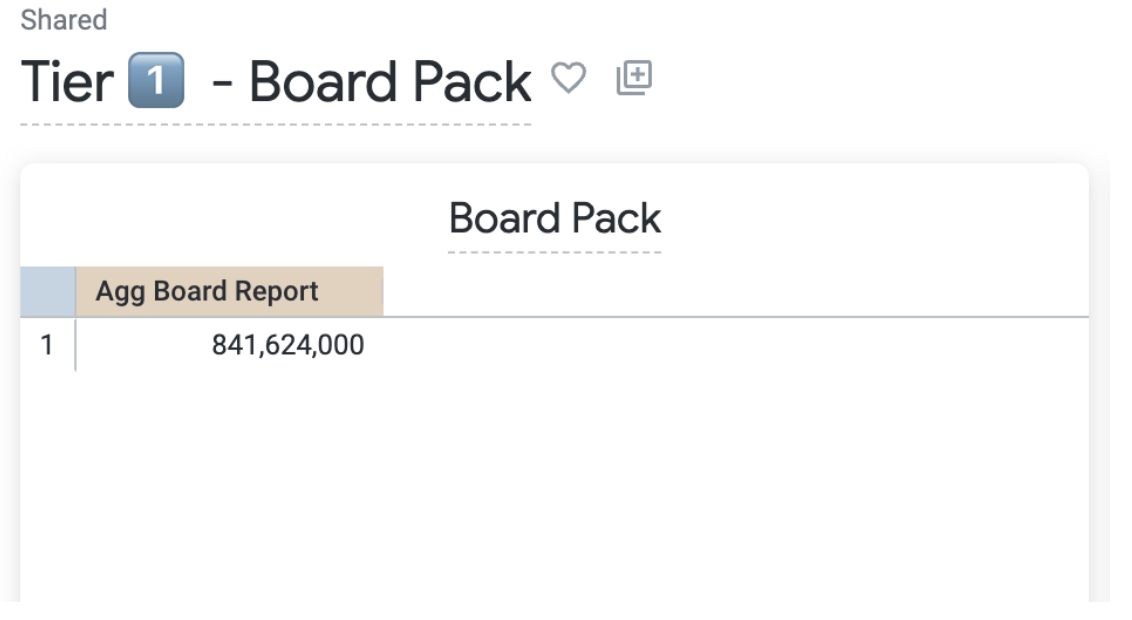
In BI tools, one option that makes it transparent to everyone is to label the title of a dashboard with e.g. “Tier 1” to indicate that it’s critical. This data can typically be extracted and used in other tools.
Defining criticality in a data catalog
In a data catalog, such as Secoda, you can easily access all your company data and find answers to common questions by searching across your stack, which makes it easier to align on metrics and models
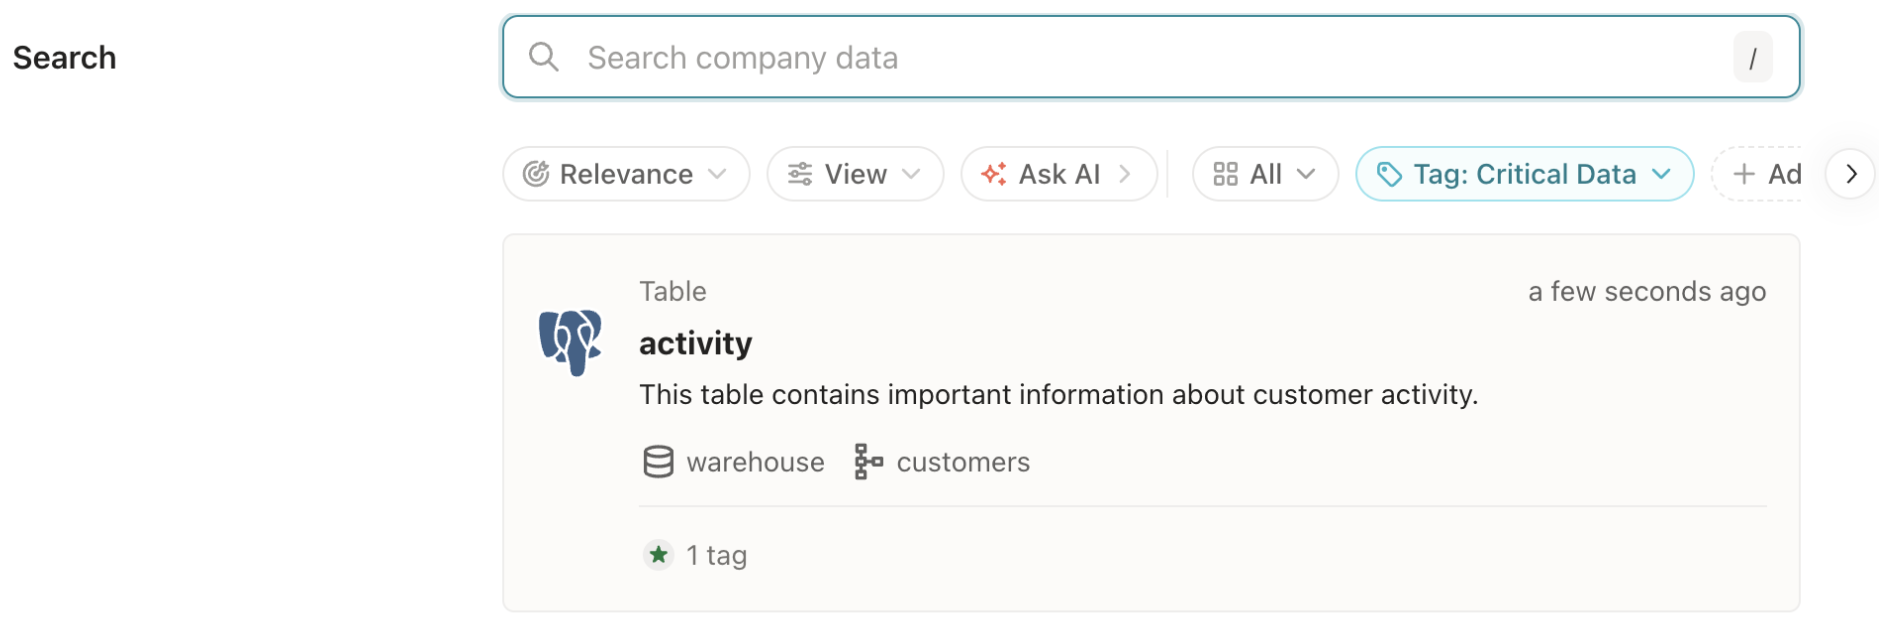
Tagging critical data in Secoda
Acting based on criticality
Mapping your business-critical assets will only pay off if you act differently because of it. Here are some processes to build in quality by design.
Dashboards
- Tier 1 dashboards need a code reviewer before being pushed to production
- Tier 1 dashboards should adhere to specific performance metrics around load time and have a consistent visual layout
- Usage of Tier 1 dashboards should be monitored monthly by the owner
Data models
- Test or run failures on critical data models should be acted on within the same day
- Issues on critical data models should be send to PagerDuty (an on-call team member) so they can be quickly actioned
- Critical data models should have at least unique and not null tests as well as an owner defined
You can read more about how to act on data issues in our guide Designing severity levels for data issues
Summary
If you identify and map out your business-critical data assets you can act faster on issues that are important and be intentional about where you build high quality data assets.
- To identify dashboards that are business critical, start by looking at your business use cases. Then consider usage data such as number of users or if anyone from the C-suite are using a dashboard
- Data models that are business-critical often have many downstream dependencies and/or critical downstream dependencies
- Define criticality, either directly in the tools where you create the data assets, or use a data catalog such as Secoda
- Be explicit about how you act on issues within business-critical assets and put in procedures for building quality by design

.png)
.png)