Hands-on with an MCP for data quality


At this point, you’ve probably heard about MCPs. For the uninitiated (like me a month ago), MCP stands for “model context protocol.” In simple terms, it’s a standard that lets apps like Cursor or Claude Desktop give an LLM (such as Claude Sonnet 4.0 or ChatGPT 5) structured context from other tools or data sources.
In our case, that context comes from metadata collected by SYNQ. This includes GitHub code extracts, metadata from data warehouses like BigQuery and Snowflake, dbt artifacts, and much more.
Together, this context enables powerful data quality workflows that would otherwise be difficult or impossible to achieve
Using SYNQ’s MCP for practical data quality workflows
Let’s look at a real-world example. We’ll use demo data on New York taxi trips, created by SYNQ’s field CTO Stephen Murphy. It includes details like trips, trip distance, and more, and will help us walk through these workflows.
- Planning a change by assessing downstream impact
- Identify the root cause of an issue
- Finding tables that should have more rigorous testing
- Holding people accountable with data quality metrics
Planning a change by assessing downstream impact
A common scenario is wanting to change the definition of a metric. In this case, we want to update the `trip_distance` metric in the `nyc_taxi_rides` dbt model.
A column-level lineage tool gives us a solid starting point that would be hard to get otherwise. We can see which data models, dashboards, and even specific fields will be impacted. However, when dozens or even hundreds of tables sit downstream, it becomes difficult to fully gauge the effect. It also misses critical information, such as whether any anomaly monitors will be impacted.

Let’s turn to Claude and ask the question instead.
What’s the downstream impact of making a change to the trip_distance field in the nyc_taxi_rides model? Include as much detail as you can around critical use cases
To start with, it gives us a clear overview of the impact: how many times the column is used downstream, which models rely on it, what calculations it feeds into, and who the business owner is. That alone is already useful.

Not only that, it also gives us a weighted risk assessment taking into account the importance of the different data products that are impacted.

Finally, it shows that it has a broader view of your data quality stack. Here, it shows that a specific metric will change, a SYNQ anomaly monitor will be impacted directly

Combined, these are exactly the things I’d want to know before making a change to a column, and a lot of added value from a stand-alone lineage view. It also goes to show the benefit of creating richer metadata—the more rigorous you are about defining your critical data use cases and their ownership, the more accurate the assessment will be.
See the full impact summary report here
Identify the root cause of an issue
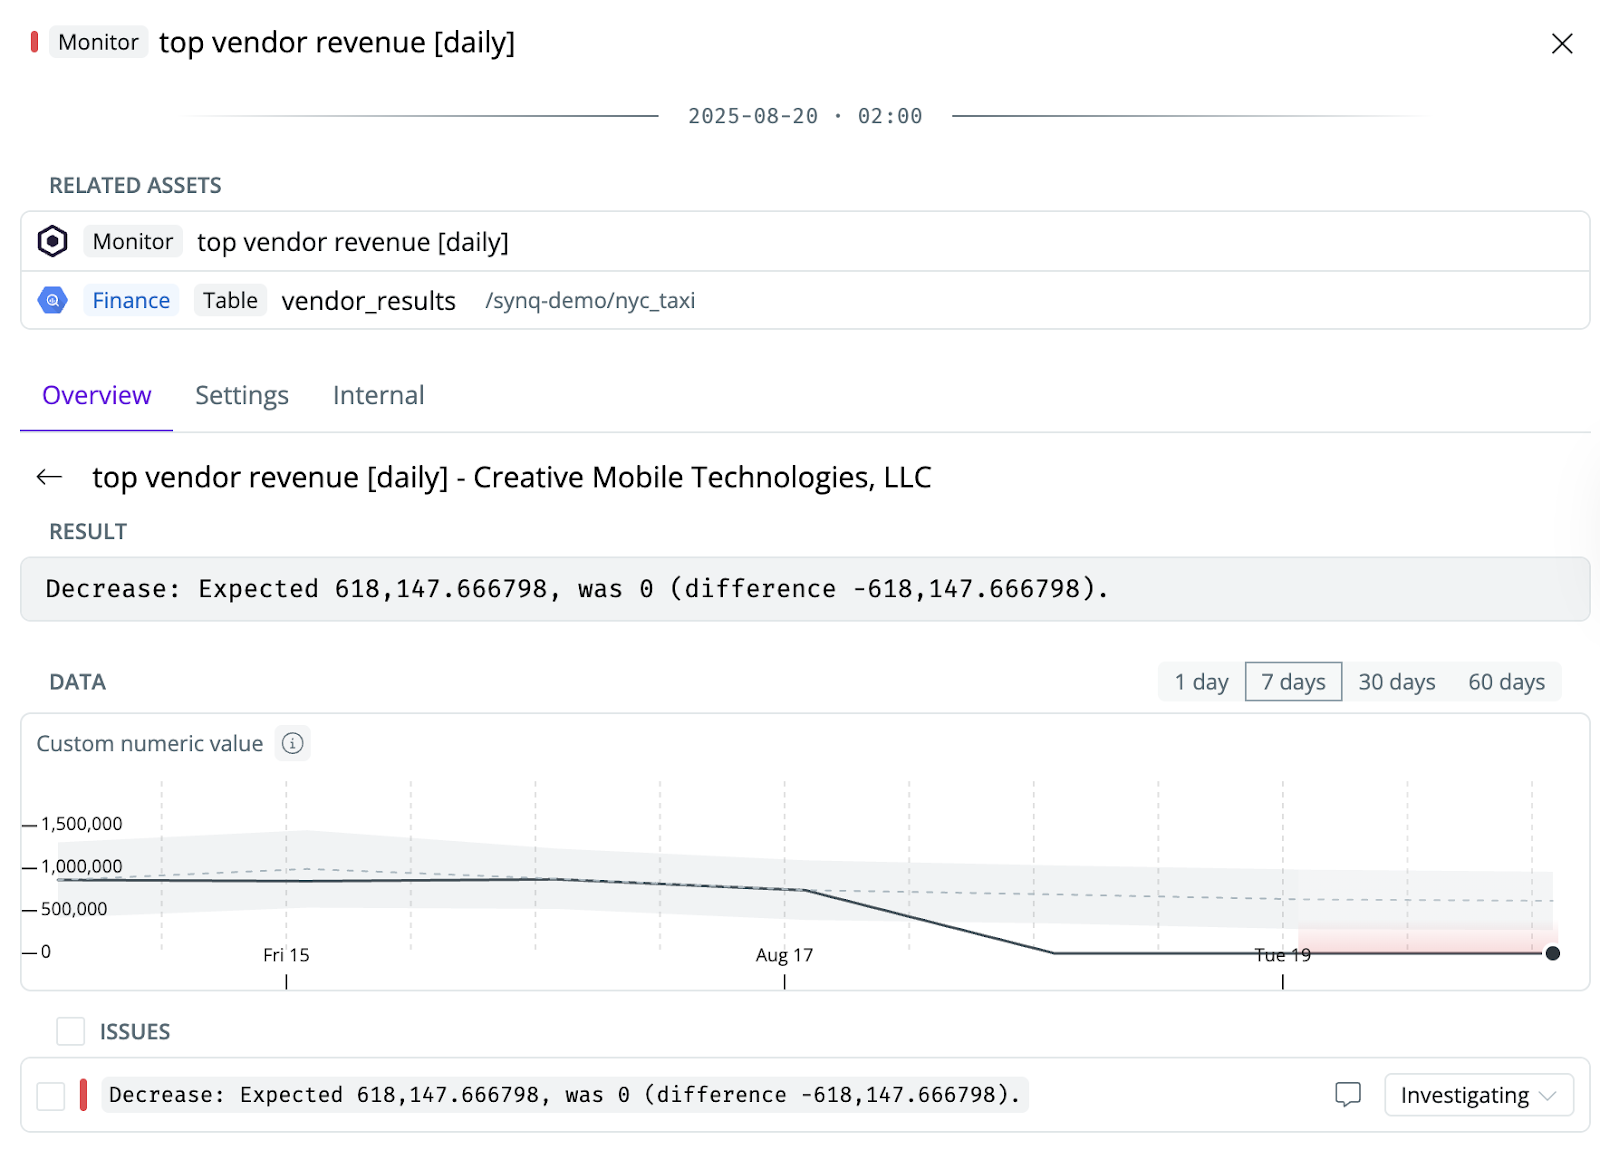
Here’s another classic issue in the life of a data practitioner: Getting to the root cause of a data issue. In this example, we’ve defined an anomaly monitor in SYNQ that tracks revenue for each vendor within the `vendor_results` table. Recently, the revenue for one vendor dropped well below the expected range, triggering an anomaly alert.
Getting to the root cause of issues like this can take anywhere from a few minutes to most of a day. In the simplest case, the error message clearly states what went wrong. In the worst case, you need to dig through many upstream dependencies and code changes, often in areas where you have little context.
Now, let’s turn to the MCP in Claude to see how that can help.
Help me get to the root cause of this issue and document the steps you take: top vendor revenue [daily] - Creative Mobile Technologies, LLC
Pretty cool! We get a clear summary of how the LLM is running the investigation, including mapping out the lineage, checking upstream failures, and inspecting code changes.

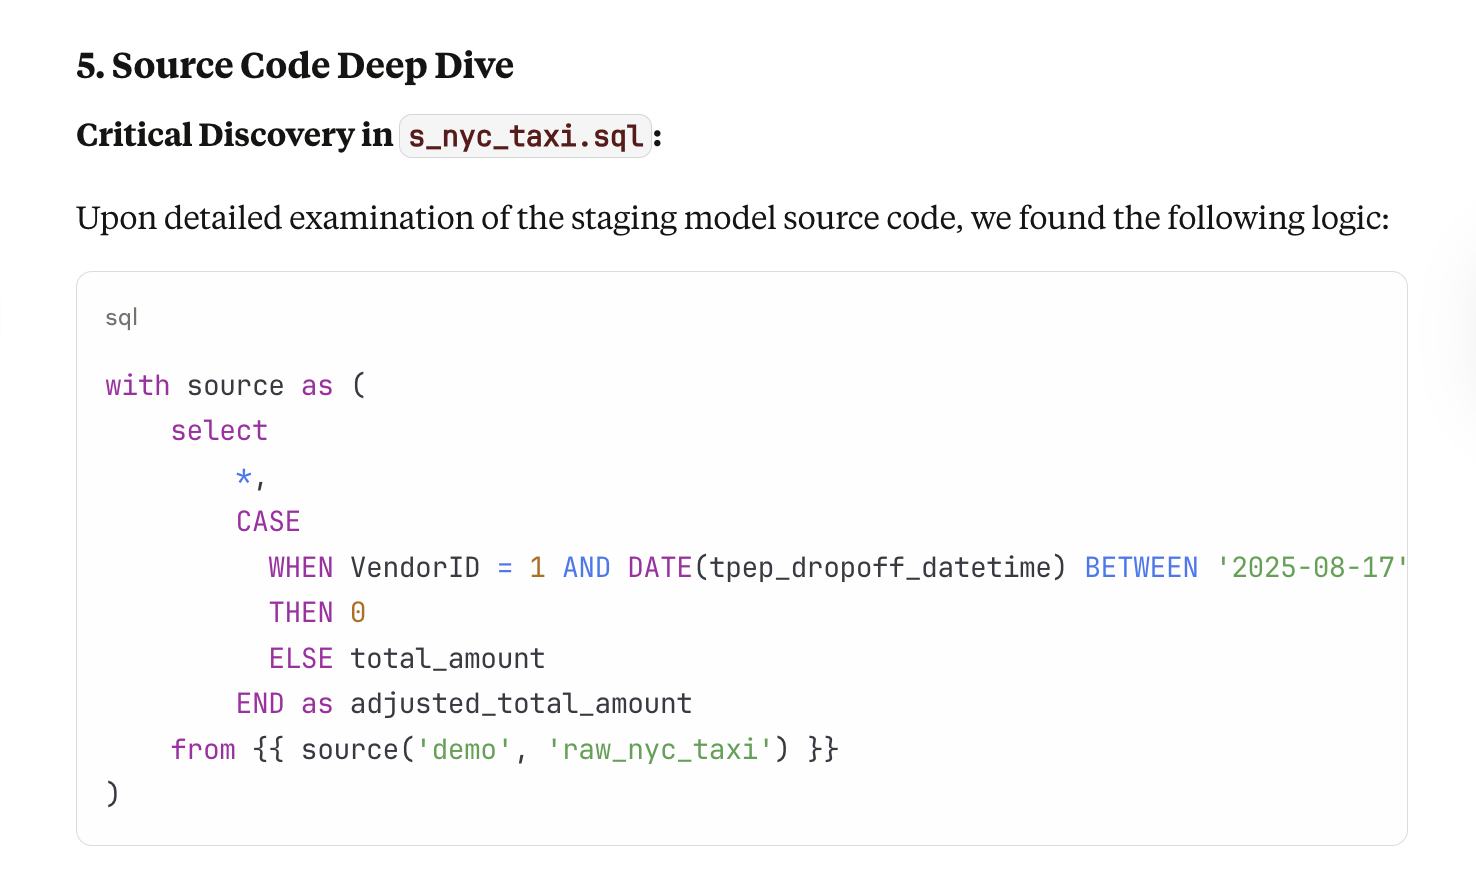
In step 5, Source Code Deep Dive, it eventually gets to the conclusion that someone has fiddled with the actual code to introduce an anomaly (looking at you, Stephen Murphy 👀)
Looking a bit closer, it’s impressive how clearly it explains each step in the debugging process.
First, it maps out the upstream dependencies.

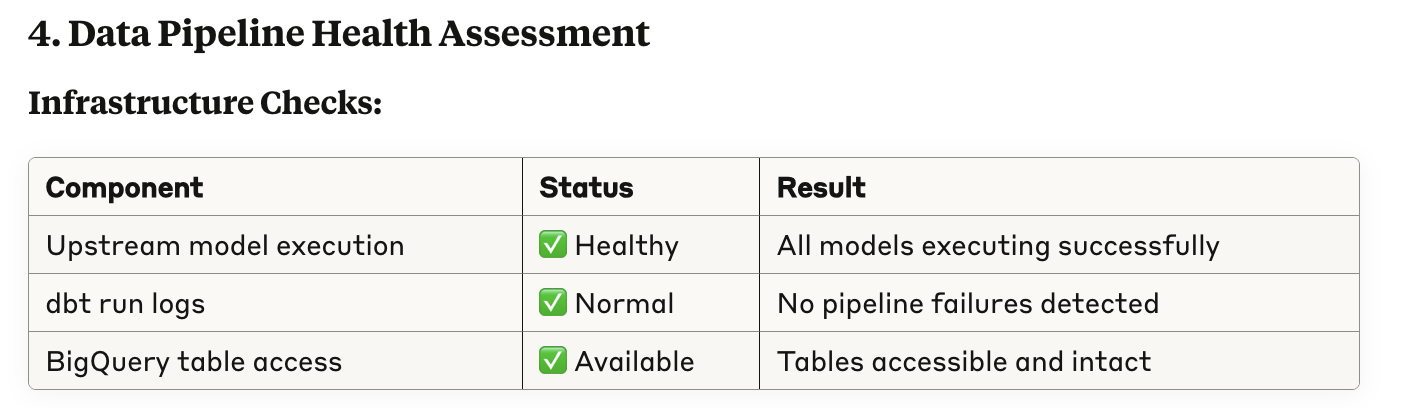
Second, it verifies that upstream checks and runs have been executed.
Third, it evaluates recent code changes.

These are exactly the steps I would have taken to perform root cause analysis. In our example, we’re not connected to Slack or internal knowledge databases, but I can imagine that if that’s added to the context, the vast majority of issues could be debugged in examples this way.
See the full debugging report here
Finding tables that should have more rigorous testing
If you’re like most data teams, you want to make sure the most important data assets are tested thoroughly.
In fact, we’ve built an entire website dedicated to this topic. Two of our most popular guidelines are these.

Taking these guidelines as input to the LLM, we’ll ask it for advice on where we should level up our testing efforts.
I need you to analyze my data pipeline and identify which data assets should have better testing coverage. Use this approach:
I have a data pipeline with multiple layers (source → staging → transformation → data products). I want to follow a strategic testing approach that focuses on business impact rather than testing everything.
For each critical data asset in my pipeline, provide:
1. Why This Needs Better Testing
2. Existing Tests
3. Recommended Tests
4. Business Impact
First up, it identifies the `raw_nyc_taxi` table as a key asset with many downstream dependencies. As of today, it only has one anomaly monitor checking freshness and volume, which hardly covers all the potential issues that could arise in the model.

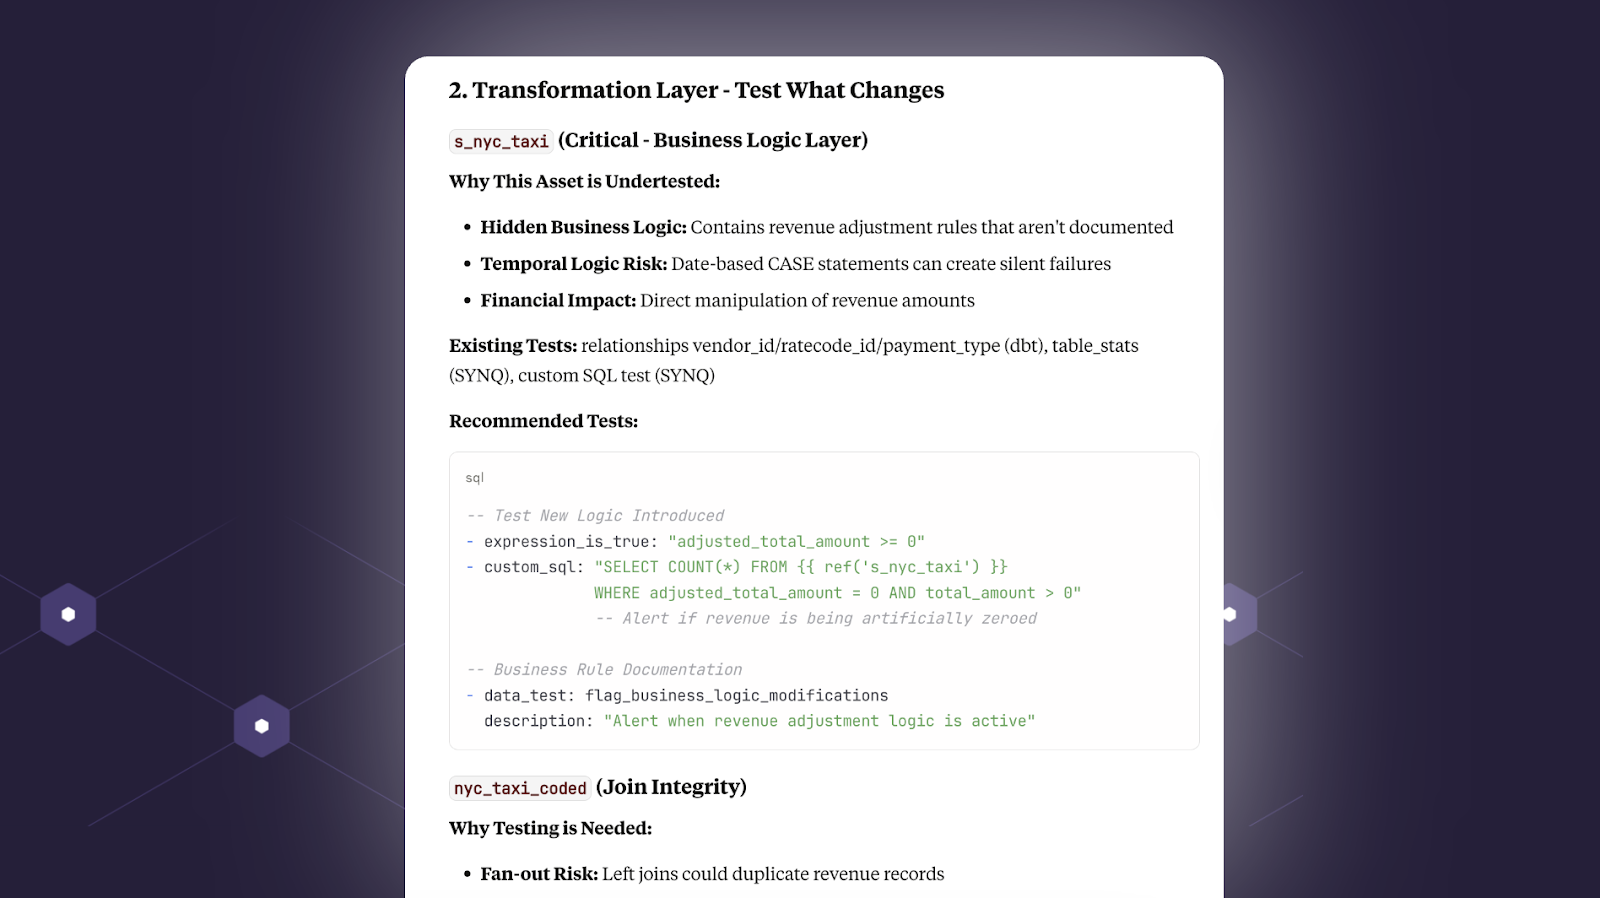
Second, it identifies a key staging table with transformations that are at risk of creating fan-out and suggests relevant tests.
Finally, at the output layer it suggests practical ways to test key data products and metrics. For example, the `market_share` metric should never exceed 100%. Makes sense.

See the test recommendations report here.
Holding people accountable with data quality metrics
One powerful thing about SYNQ is that it collects all your metadata over time, from dbt artifacts on historical test performance to the status of SYNQ monitors and Airflow jobs. With this, you can also ask the LLM to zoom out and look at the performance of the data stack more holistically, and over time.
Here’s a real-world summary of issues based on this prompt:
I need you to create a weekly data quality snippet for stakeholders using real data from my SYNQ system
That gives us a really useful summary, including open issues, time to resolution, and trends. This is actually not too dissimilar from what I’ve seen top-in-class data teams make.

Segmenting by ownership is particularly powerful for getting people to actually care. We’ve written extensively about this in our data quality guidelines.

In our case, it looks like the Finance team in particular has something to think about.

See the data quality report here
MCPs are most useful when combined with the right context and metadata. They can help you plan changes, debug issues, and zoom out to look at the health of your data. One thing that stands out is how transparent it can be around outlining the steps it took to get to a conclusion. This helps it feel less like a black box and more like a tool that helps you level up and save time.
Want to try it out today? Get in touch

