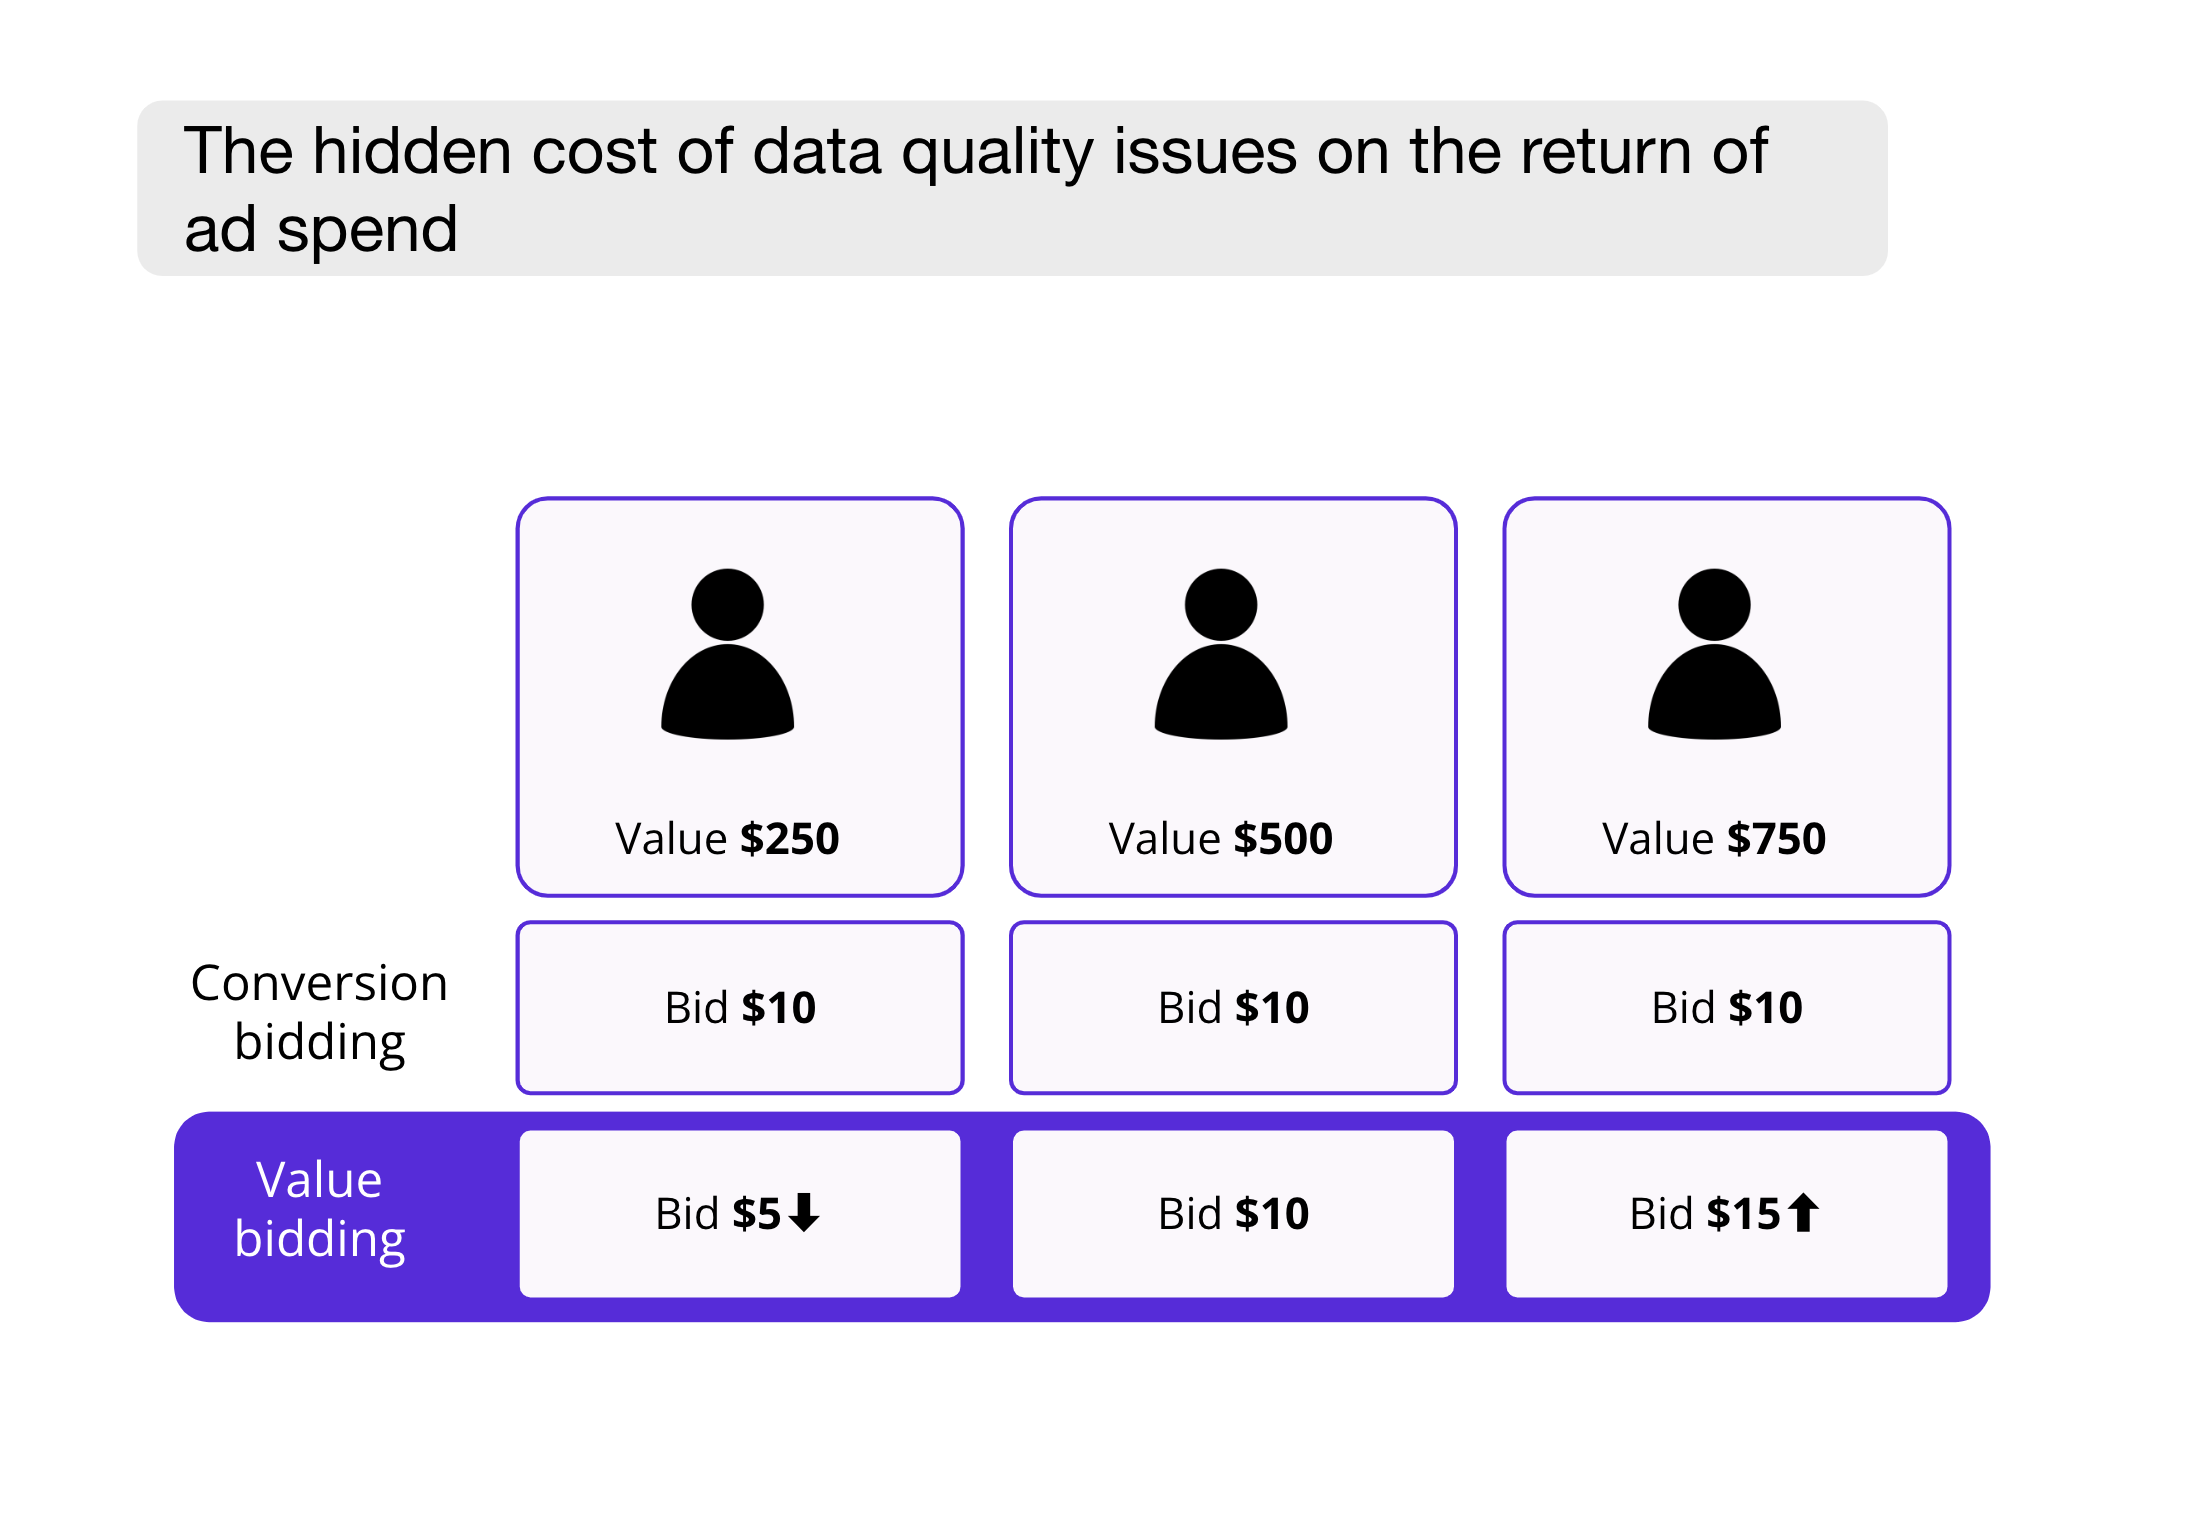
The hidden cost of data quality issues on the return of ad spend

Your data has a lot of things to say about which customers turned out to be money in the bank and which ones didn’t. Regardless of whether you work in B2B marketing where you optimize for driving free trials to paid customers or in B2C and optimize for getting first-time users to buy your product, each user has value to you.
Leading companies have become adept at predicting the lifetime value of customers at various stages based on their interactions with websites or products. Armed with this data, they can adjust their bids accordingly, justifiably paying an extra $5 for a user who is likely to generate an additional $50 in their lifetime.
In other words, you’re sitting on a goldmine that you can turn into predictions and input directly to Google and Meta to adjust your bidding strategy and win in the market by paying the price that’s right for each customer.
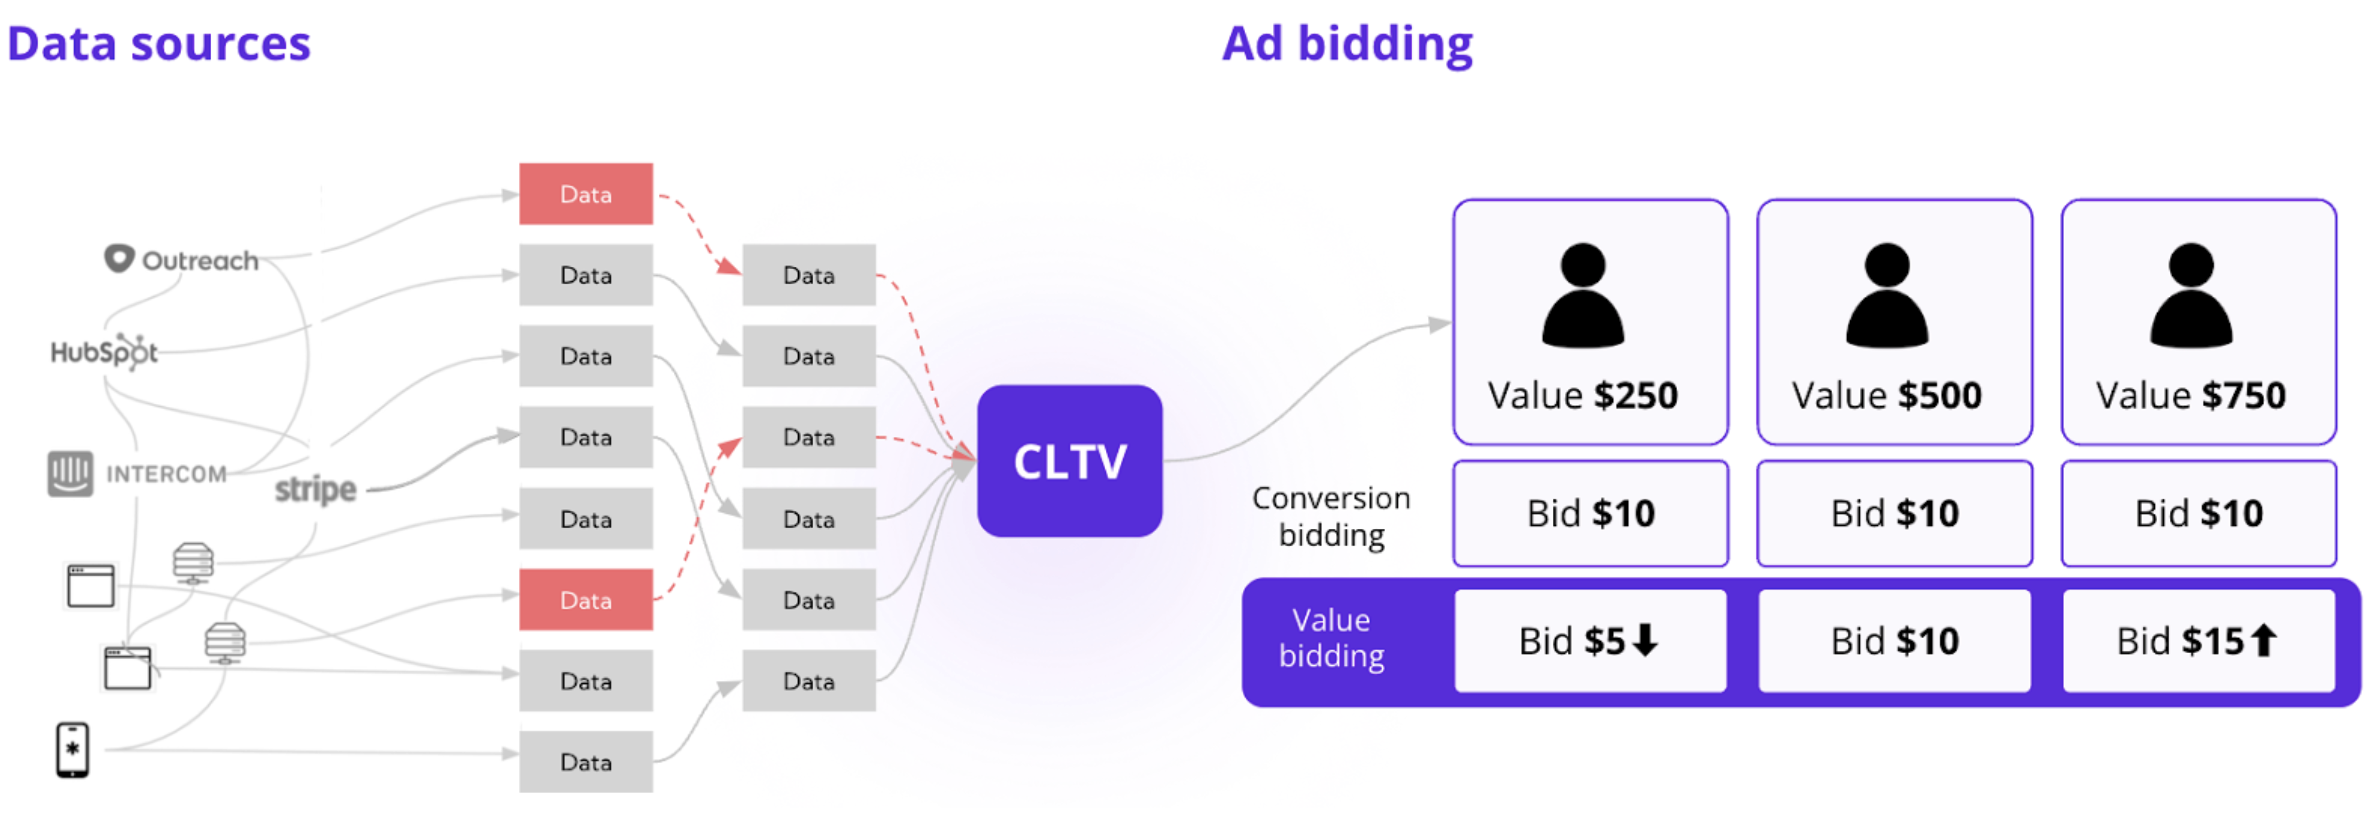
Data issues impacting the customer lifetime value (CLTV) calculation cause value bids to be based on wrong assumptions
But the return on your ad spend is only as good as your customer lifetime value calculations.
The average 250-500 person company uses dozen of data sources across many hundreds of tables and don’t always have the right level of visibility into whether the data they use is accurate. This means that they’re allocating the budget to the wrong users and wasting hundreds of thousands of dollars in the process.
In this post, we will delve into the data quality issues data-driven marketing teams face as raw data undergoes transformation, serving as input for value-based bidding in ad platforms. We’ll specifically address the following areas:
- 360 overview – why it’s important to have an overview of your entire marketing data stack
- Monitoring – common issues that you should look out for in your marketing pipelines
- People & tools – the importance of aligning people and tools to build reliable marketing data pipelines
Why you need a 360 overview of your marketing pipelines
To gain an understanding of the value of each customer, you can analyze user behaviors and data points that serve as strong indicators. This often reveals a list of predictive factors, derived from dozens of different systems. By combining these factors, you can obtain a full view of your customers, and connect the dots to understand the key drivers behind behaviors and actions that indicate that a customer has a high value.
For example, if you are a marketeer in a B2B company, you may have an understanding of the factors that drive customers to transition from free to paid users.
- Logging in twice makes customers 50% more likely to convert (Stripe)
- Referring others within 7 days makes customers 70% more valuable (Segment)
- Users with company email addresses and 250+ employees are 30% more likely to become paying customers (Clearbit)
- Mobile-only logins decrease customer value by 30% (Amplitude)
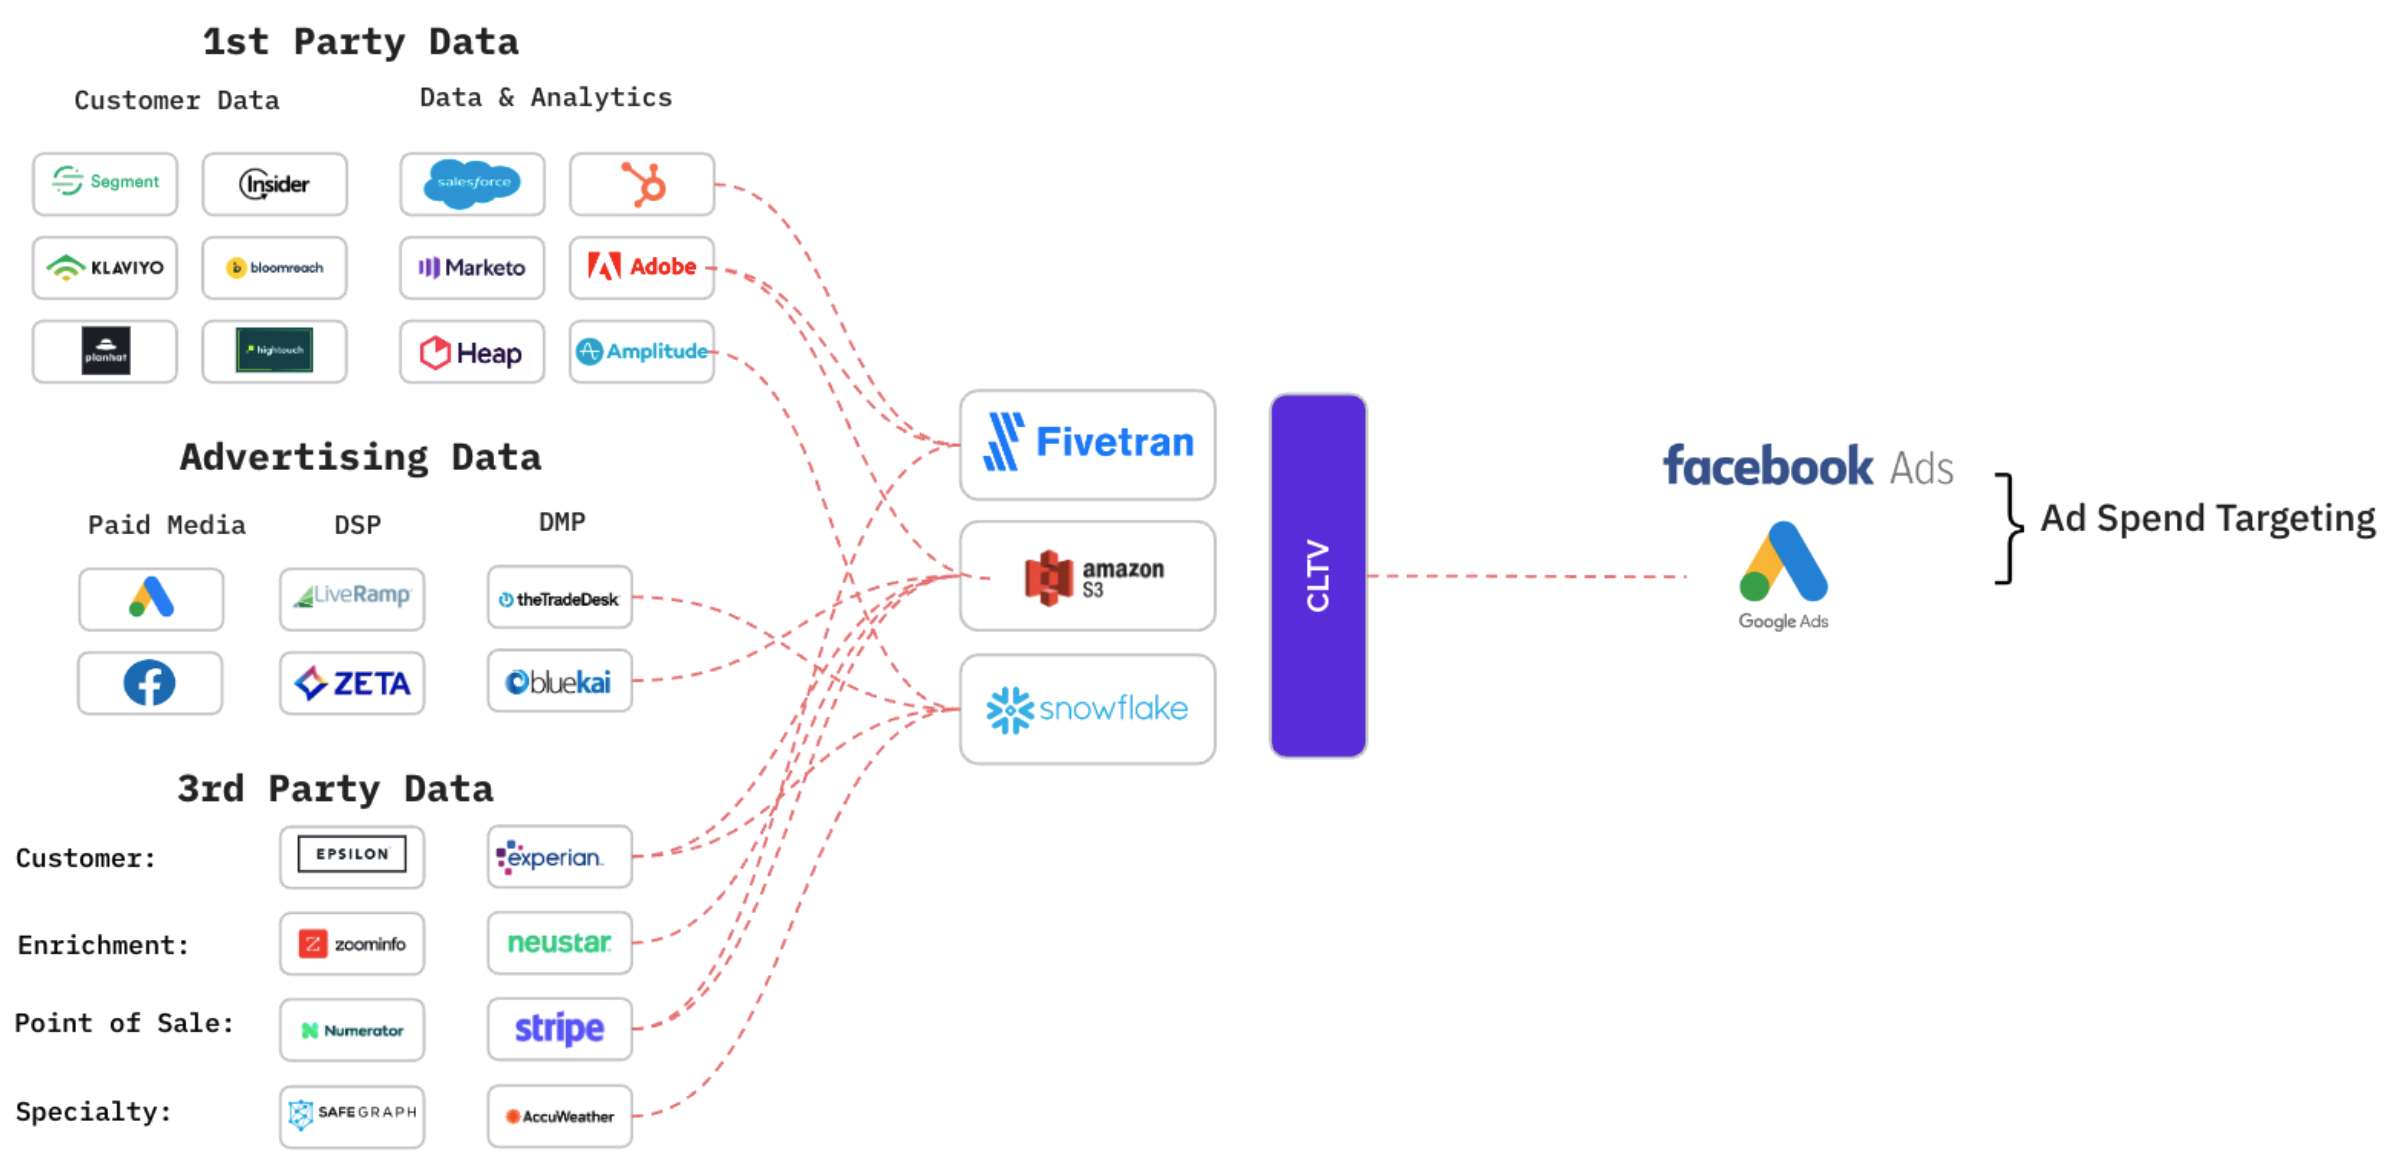
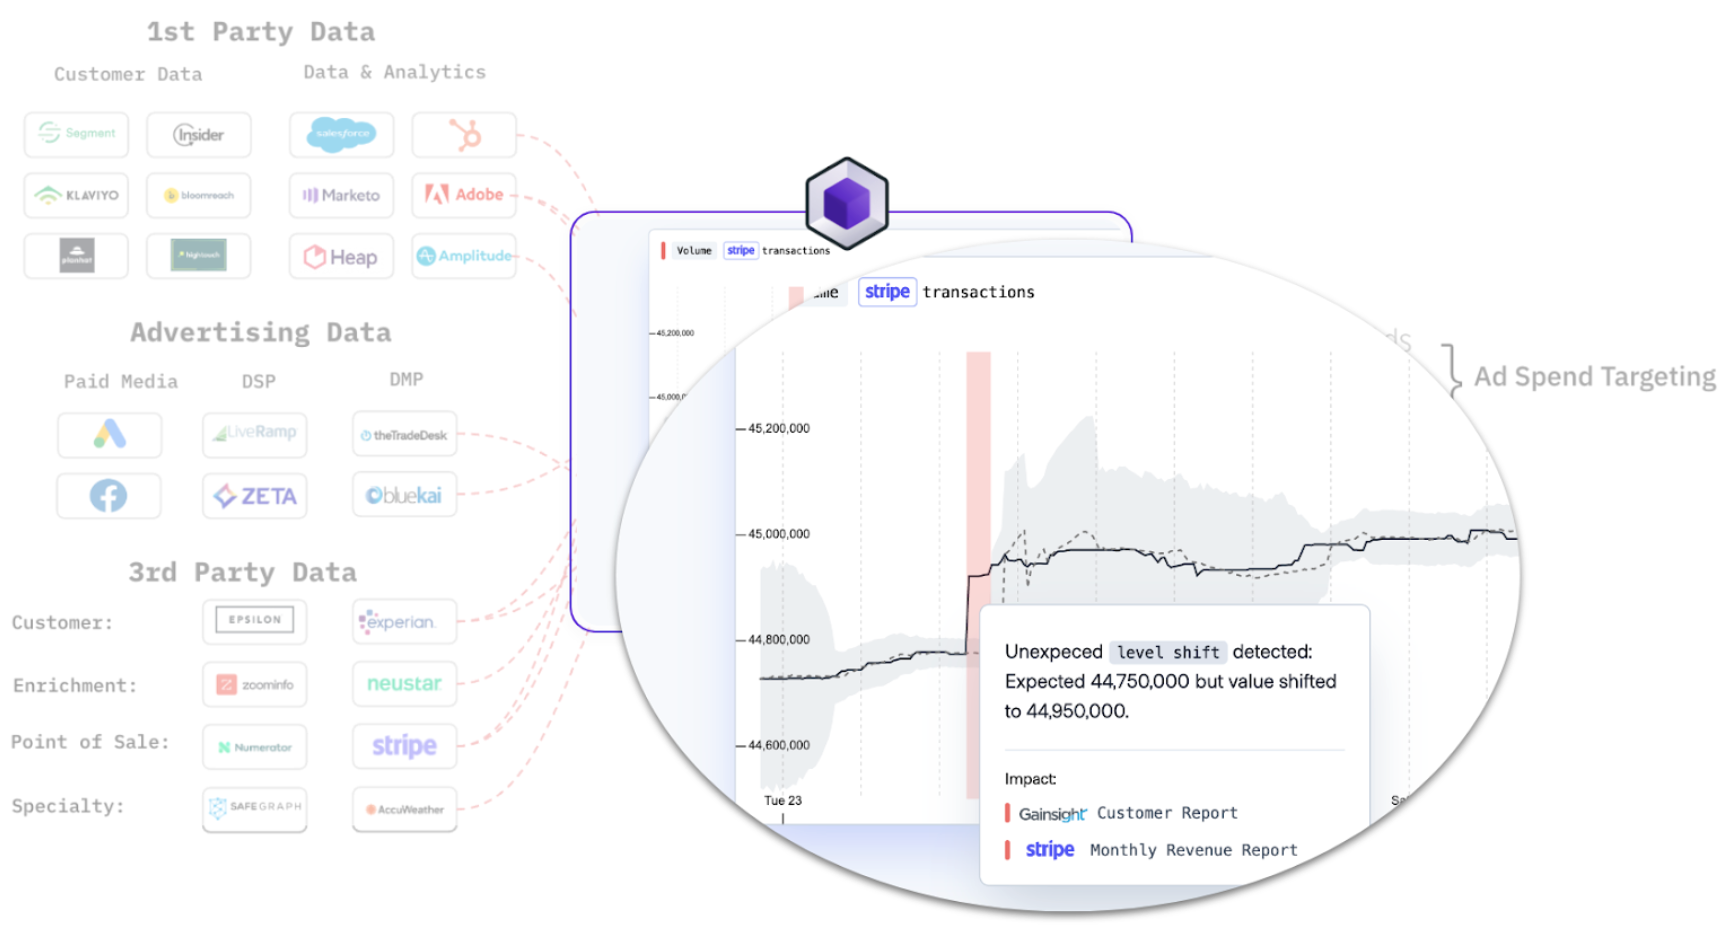
Dozen of upstream sources go into the data warehouse before being sent to Google & Facebook for ad bidding
Without a comprehensive overview, you may mistakenly assume the accuracy of data inputted into your bidding systems, only to later realize critical issues such as:
- Incorrect extraction of company size from email domain names due to faulty Clearbit/Segment integration.
- Event tracking conflicts result in missing data for essential actions in the checkout flow from Amplitude.
- Inaccurate data sync from the Stripe integration, leading to incomplete information about customer purchases.
“Our CLTV calculation broke due to an issue with a 3rd party data source. Not only did we lose some of the £100,000 we spent on Google that day but we also had to wait a few days for the CLTV model to recalibrate” - 500 people fintech
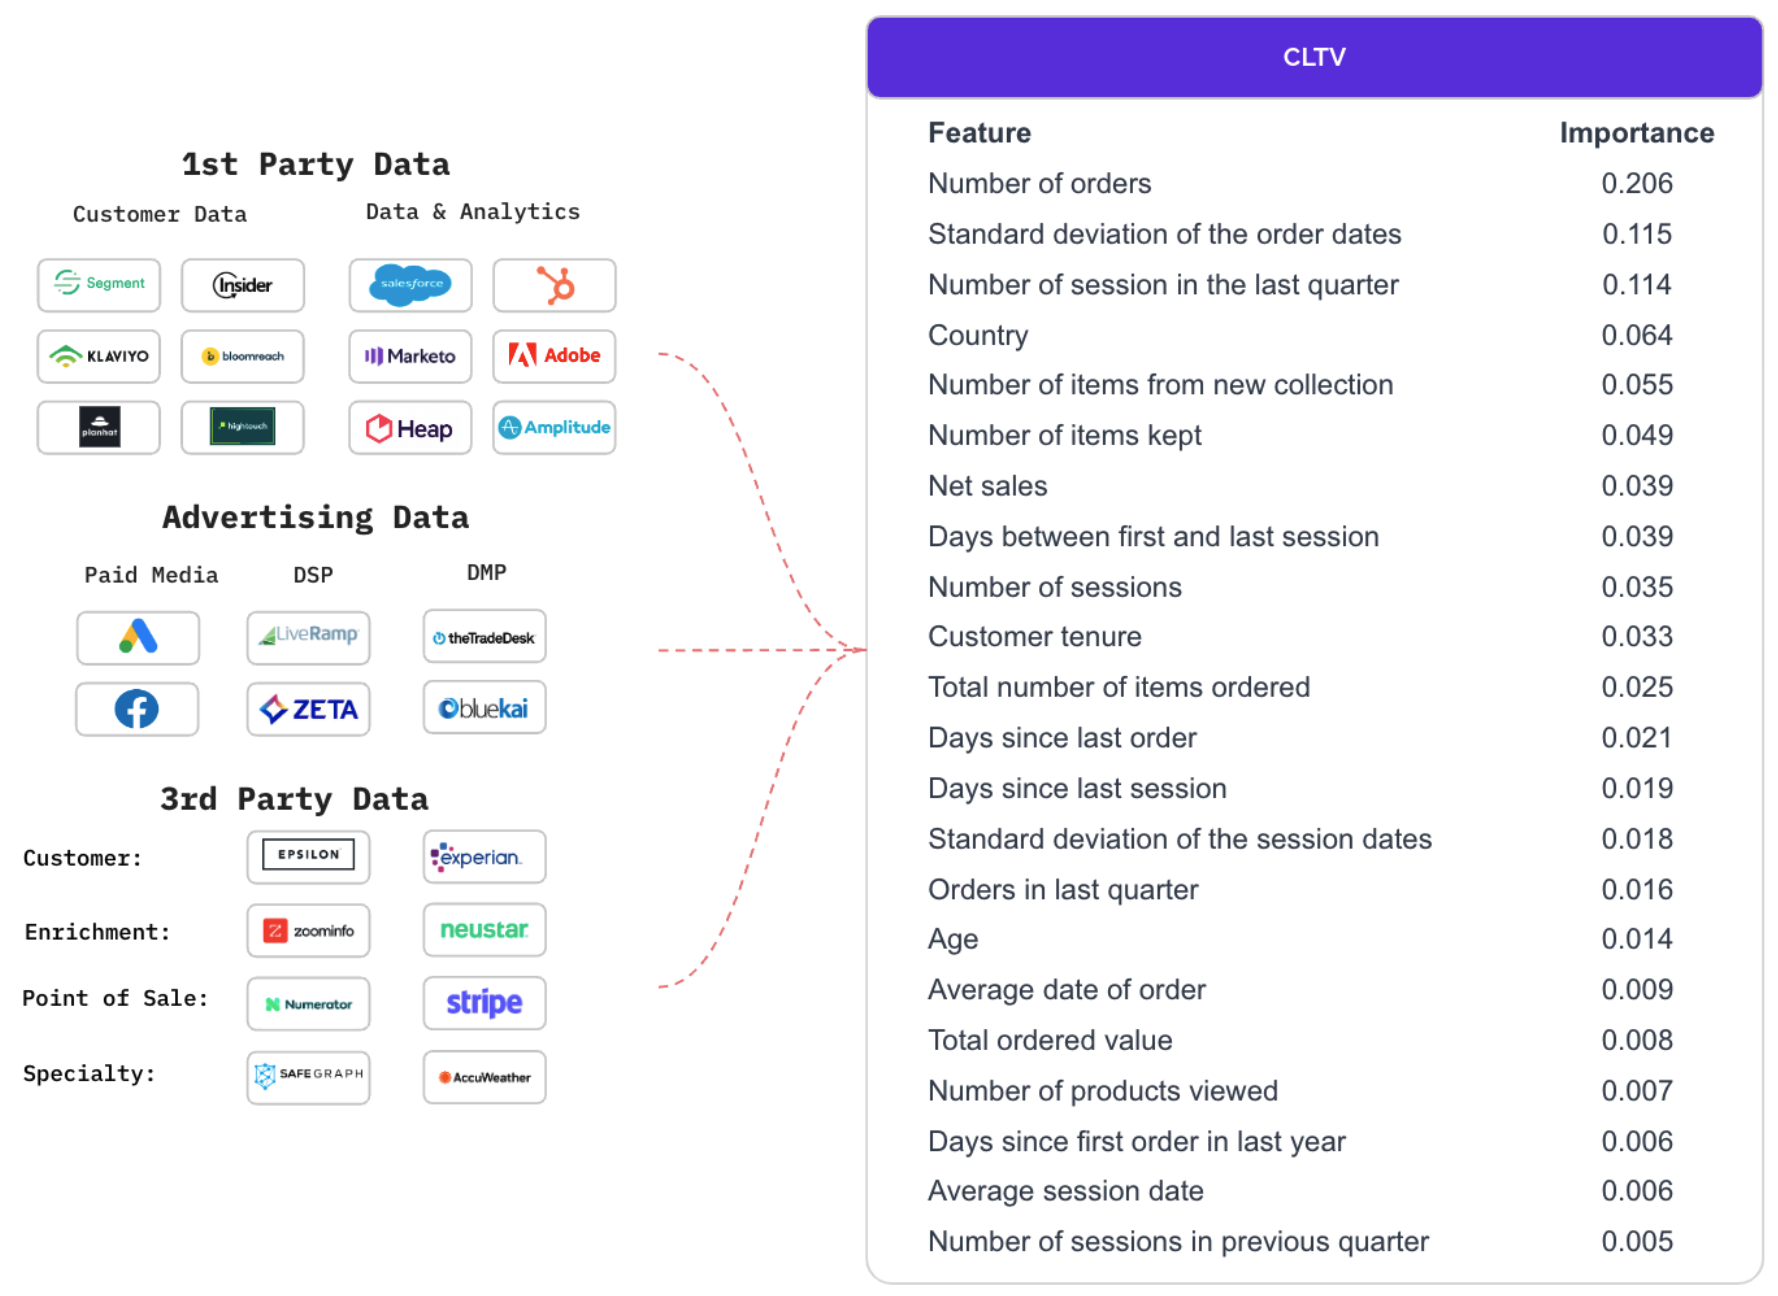
The significance of multiple factors in predicting CLTV for online retailer ASOS is highlighted in a research paper. The study finds that key factors include order behaviors (e.g., number of orders, recent order history), demographic information (e.g., country, age), web/app session logs (e.g., days since last session), and purchasing data (e.g., total ordered value). These insights are the outcome of hundreds of data transformations and integrations of dozens of 3rd party sources.
ASOS – factors to determine CLTV
Data issues – known unknowns and unknown unknowns
Having a comprehensive data overview is not enough; it is important to proactively identify potential issues affecting CLTV calculations. These issues can be categorized into two types:
Known unknowns: issues that are discovered and acknowledged, such as pipeline failures leading to the Google API not syncing data for 12 hours.
Unknown unknowns: issues that may go unnoticed, such as incorrect syncing of product analytics event data to the data warehouse, resulting in inaccurate assumptions about user behavior.
“We are spending $50,000 per day on Facebook marketing and one of our upstream pipelines was not syncing for 3 days causing us to waste half of our budget. We had no idea this was happening until they notified us” - 250 people eCommerce company
To proactively identify and address data issues impacting CLTV calculations, consider monitoring across the following areas:
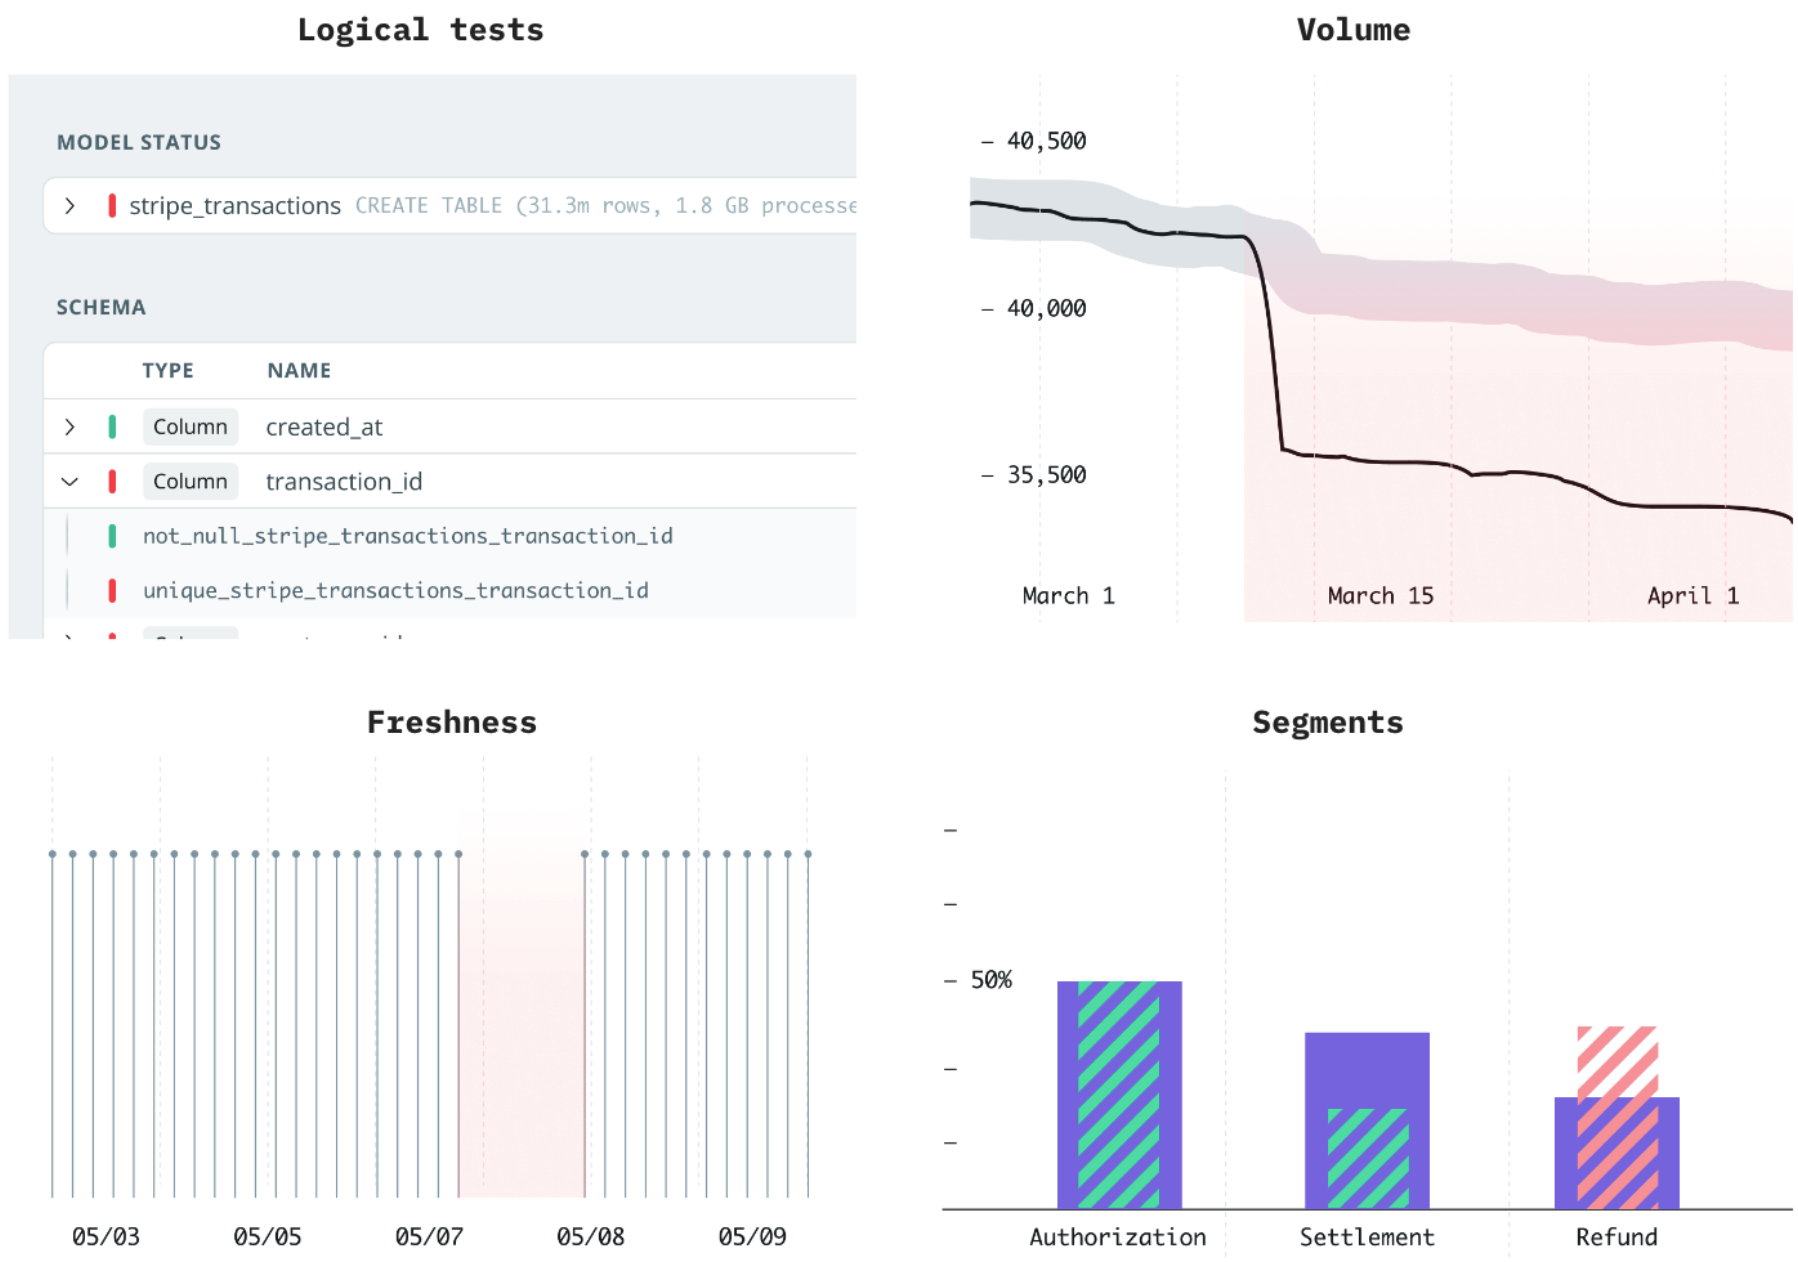
Logical tests: Apply assumptions to different columns and tables using a tool like dbt. For example, ensure that user_id columns are unique and order_id columns never contain empty values. Implement additional logical checks, such as validating that phone number fields only contain integers or that the average order size is not above a reasonable limit.
Volume: Monitor data volumes for anomalies. A sudden increase in new rows in the order table, for instance, could indicate duplicates from an incorrect data transformation or reflect the success of a new product.
Freshness: Be aware of the latest refresh times for all data tables, as data pipeline failures may go unnoticed in more granular areas. For instance, an integration issue pausing the collection of company-size data from Clearbit could persist without immediate detection.
Segments: Identify issues within specific segments, such as mislabeling certain product categories, which can be challenging to detect without proper checks in place.
Establishing responsibility and ownership
Once you have a comprehensive overview of your data and monitoring systems in place, it is key to define responsibilities for different aspects of monitoring. In the examples mentioned earlier, data ownership spans product usage, demographics, billing, and orders. Assigning owners for relevant sources and tables ensures prompt issue triaging and resolution.
“We had an important test alert go off for weeks without it being addressed as the person who was receiving the alert had left the company” - UK Fintech Unicorn
Additionally, prioritize the most critical components of your data product and establish Service Level Agreements (SLAs). Regularly assess uptime and performance to address any areas requiring attention in a systematic manner.
Building reliable marketing data pipelines with Synq
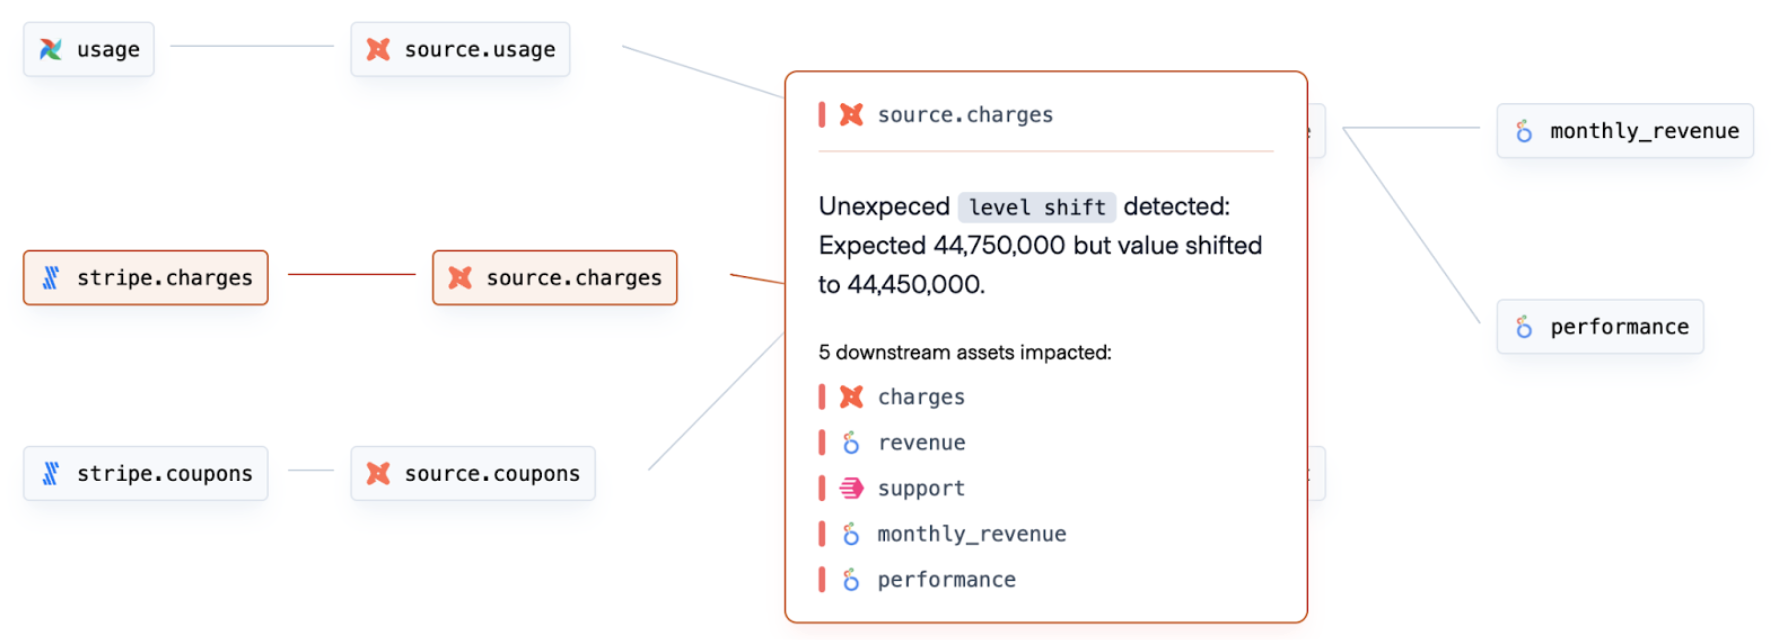
To address unknown unknowns and detect errors in marketing data products, Synq offers an all-in-one solution that combines your existing tests and self-learning anomaly monitoring.
Synq adapts to the seasonality of your business, incorporates your feedback, and delivers actionable predictions. Monitors run every 30 minutes, encompassing all data used for CLTV calculations, and automatically infer the relevant sources to monitor so you don’t have to allocate dedicated data engineering time.
Synq highlighting a sudden jump in the volume of Stripe data through automated anomaly monitoring
Achieving a 360 overview with Synq: With less than 30 minutes of setup time, Synq automatically infers your data landscape, integrates existing logical tests, and activates ownership across engineering, analytics, and BI teams. Relevant business stakeholders can also be notified of any affected areas.
Synq automatically infers a 360-degree overview of your data
About Synq
Synq is a data observability platform trusted by forward-thinking teams. We work with top companies like Typeform, Cazoo, and Intstabee to build reliable data where it matters most.
“Synq plays a big part in reducing overhead for us in managing the complexity across our existing stack. Despite the complexity of our setup we were up and running without any custom engineering work” - Head of Analytics, Cazoo
If you want to learn more about how Synq can help build reliable marketing data pipelines, we’d love to speak with you. Reach out to mikkel@synq.io.

.png)
.png)