Building reliable data in fintech

All data teams have challenges. Still, fintech companies have it more difficult than most. The stakes are often higher, and when something breaks, it can put the company at extraordinary risk, lead to million-dollar fines from regulators, and directly impact customers’ lives.
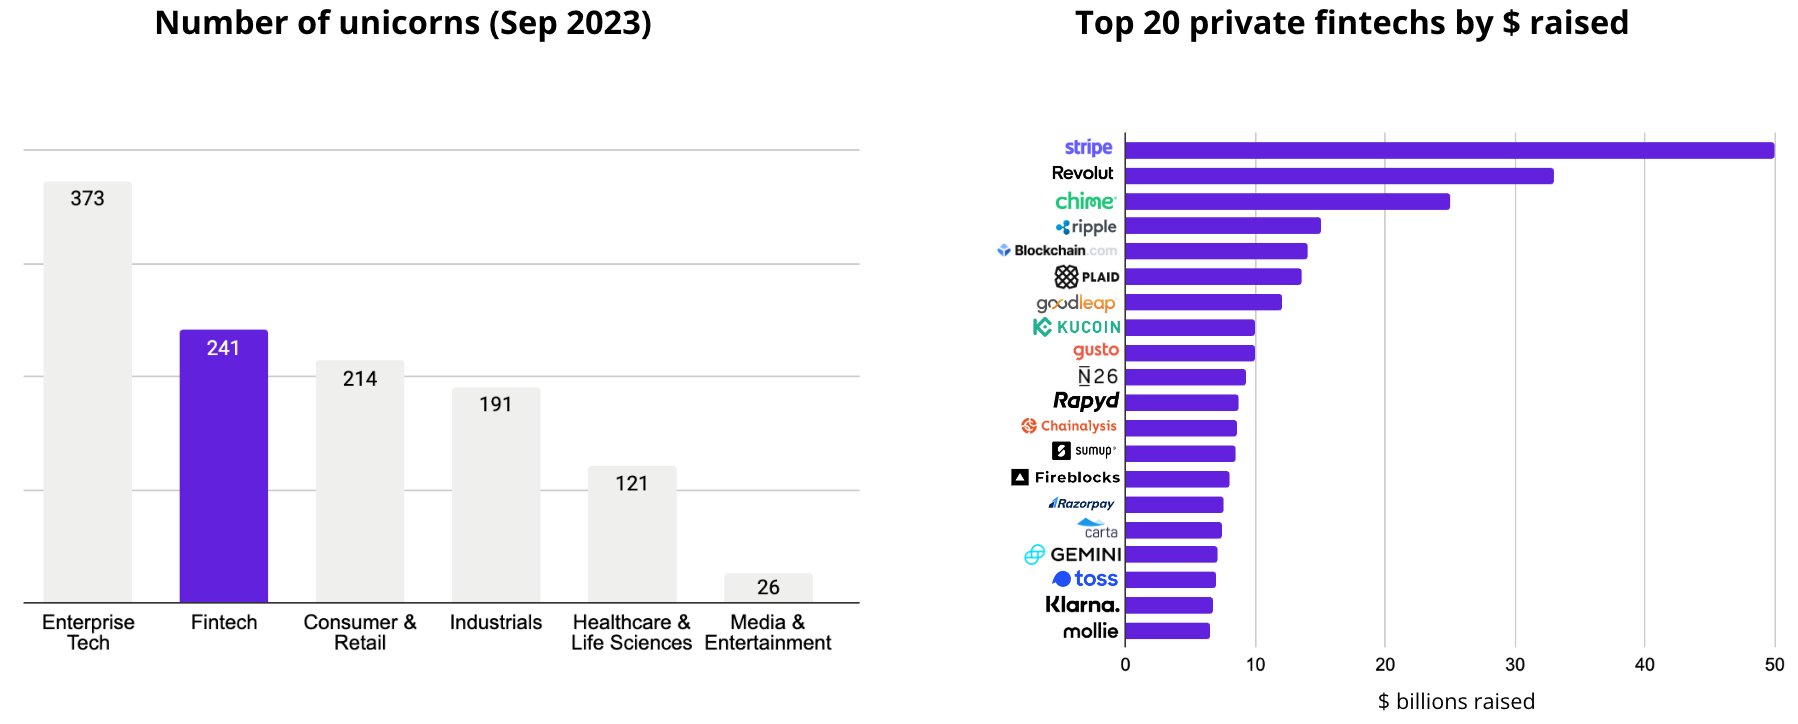
The rise of fintechs has been massive over the last decade. 241 of the 1200 global unicorns as of September 2023 are in fintech and have jointly raised more than $700b in venture capital funding.
Fintech companies have a more significant proportion of business-critical use cases. In other words, data issues can directly impact customers’ lives and the company’s existence. For example, a challenger bank may be required to report its capital liquidity ratio to regulators, and if the ratio falls below a threshold, drastic actions are required.
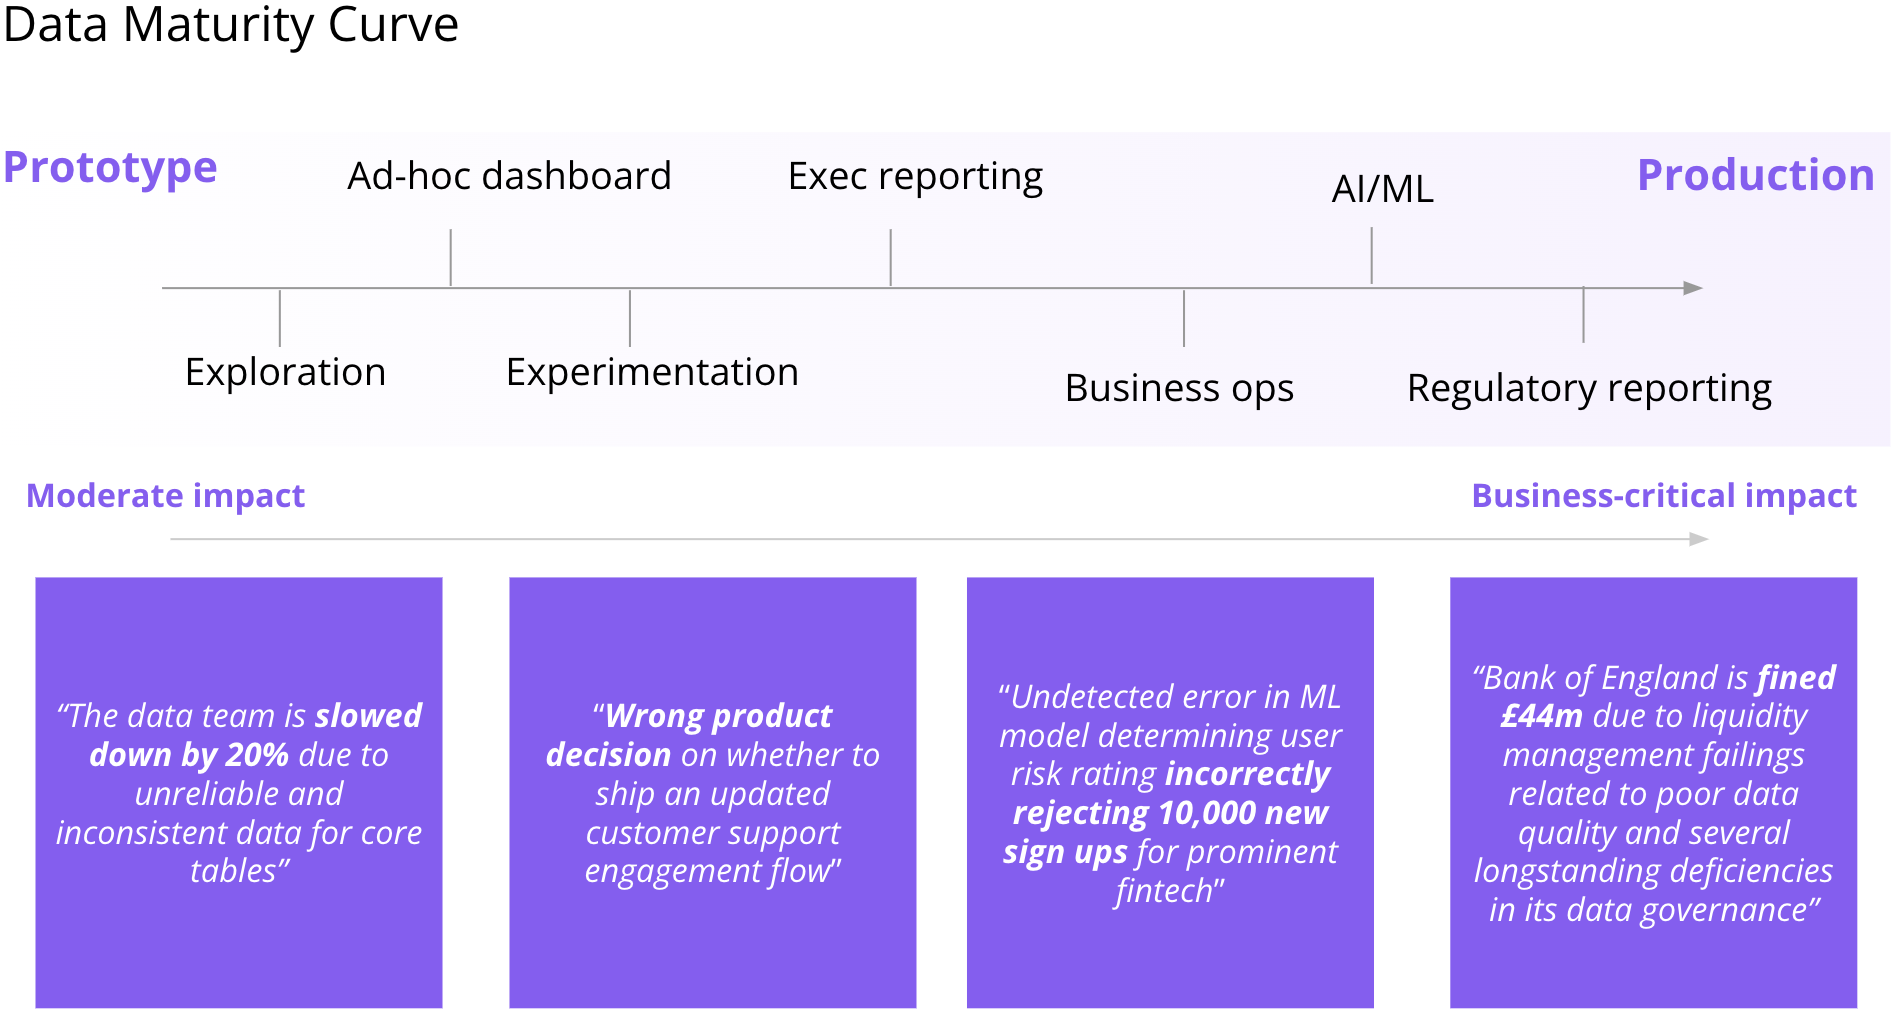
There are plenty of real-life examples of the impact of data quality issues in fintechs having a material business impact. For example, the Bank of England was fined £44m due to poor data quality and several longstanding deficiencies in its data governance.
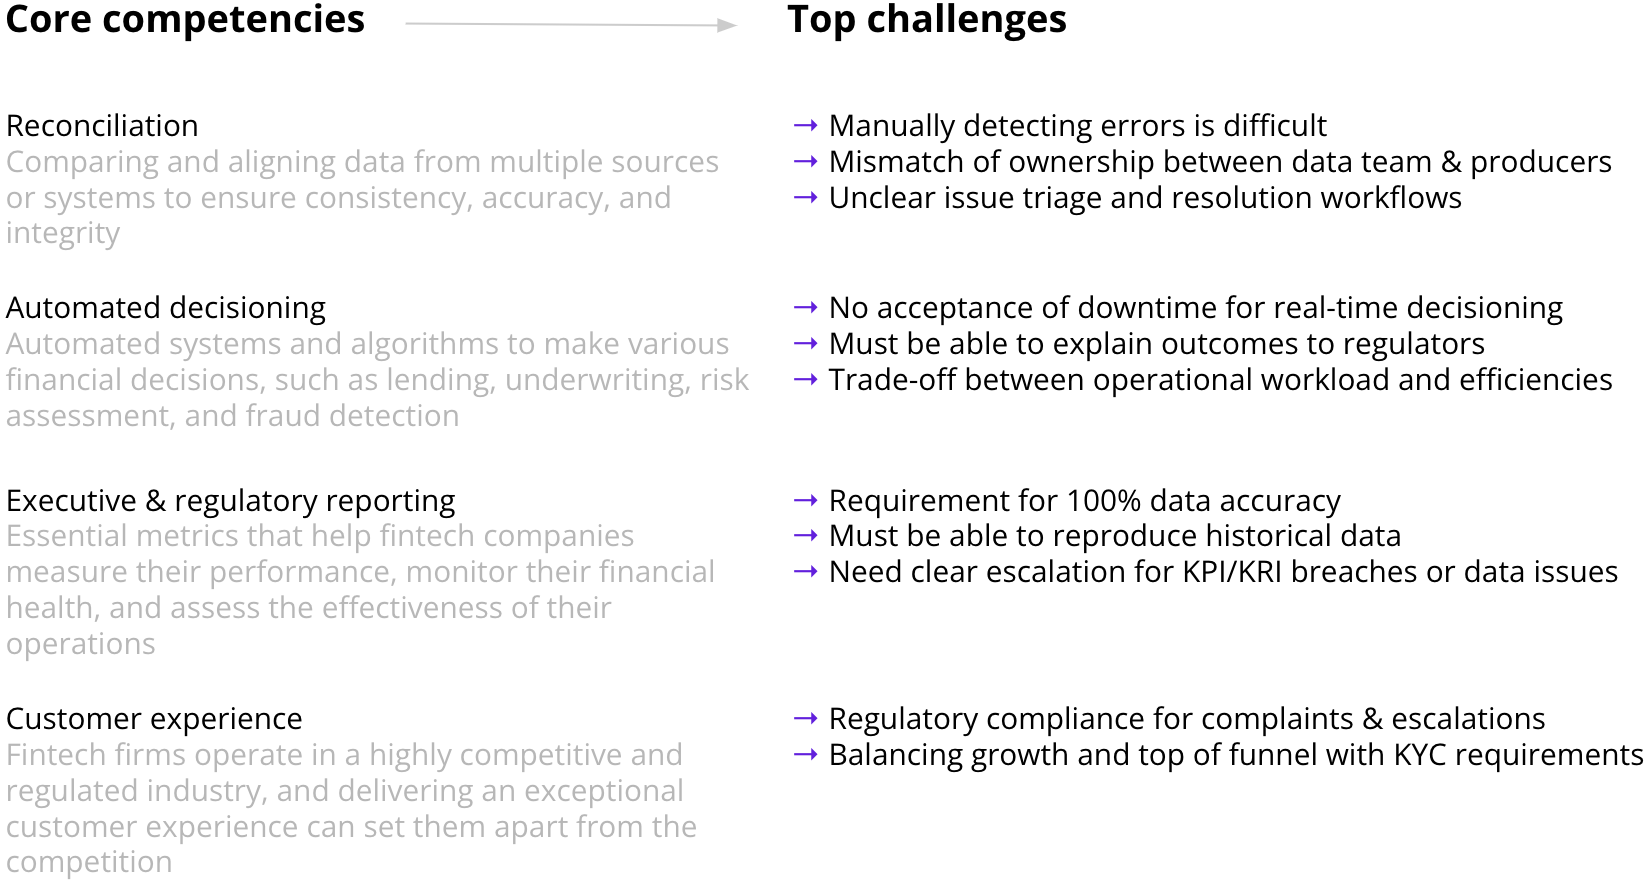
In this article, we’ll look into the top challenges fintech data teams face and some steps to overcome them.
Reconciliation as the source of data issues
Challenge: Manual data reconciliation creates inconsistencies
A common cause of issues for fintech companies is data across source systems needing to match. It’s not uncommon to rely on multiple source systems for core processes. For example, a challenger bank may use several 3rd party providers for KYC checks but also use internal tools. When data differs across these systems, it can have downstream business implications.
“We bring in data from three different systems—our origination platform, servicing platform, and internal loan engine. If we write a loan, we expect the same loan amount, interest rate, reversion rate, etc., on the offer letter to match up with all of the systems. However, we were finding small errors where someone changed data in one place, and it hadn’t synced through to other systems, or they retrospectively changed the data after we had already produced reports or offers.” - Rupert, Data Lead at LendInvest
For businesses operating in the heavily regulated financial services sector, this kind of mismatch can be much more than a mere annoyance. For example, making errors on loan offers and failing to provide pristinely audited data pose serious issues, and even relatively small mistakes can result in severe reputational and regulatory consequences.
With potentially hundreds of systems to reconcile, often across millions of customers, doing this manually can take a lot of effort, have a slow turnaround time, and be prone to human errors.
Challenge: Unclear ownership between owners and the data team
Often, end-users or the data team detect issues caused by reconciliation errors. However, the people responsible for fixing the underlying issue, such as an underwriter or a lending team, are only sometimes in the know. This creates a lack of ownership, results in slow issue resolution times, and puts additional pressure on the data team that has to triage and escalate issues outside their control.
Solution: Automating data reconciliation with assertion tests and active ownership model
dbt provides a robust testing suite to encode business exceptions into tests that can be run several times daily to proactively catch issues where data does not match in source systems. In addition to the out-of-the-box tests dbt offers, we recommend using dbt-expectations to encapsulate even advanced business logic into code.
For example, LendInvest, one of the largest non-bank mortgage lenders in the UK, implemented an industry-leading automated reconciliation system using dbt Cloud, Synq, and Metabase.
First, the data team built dbt models to extract and transform loan data from the organization’s three core systems before normalizing it into comparable formats. Custom dbt assertion tests then check for discrepancies across the systems, such as differences in the loan amount, interest rate, or other key fields.
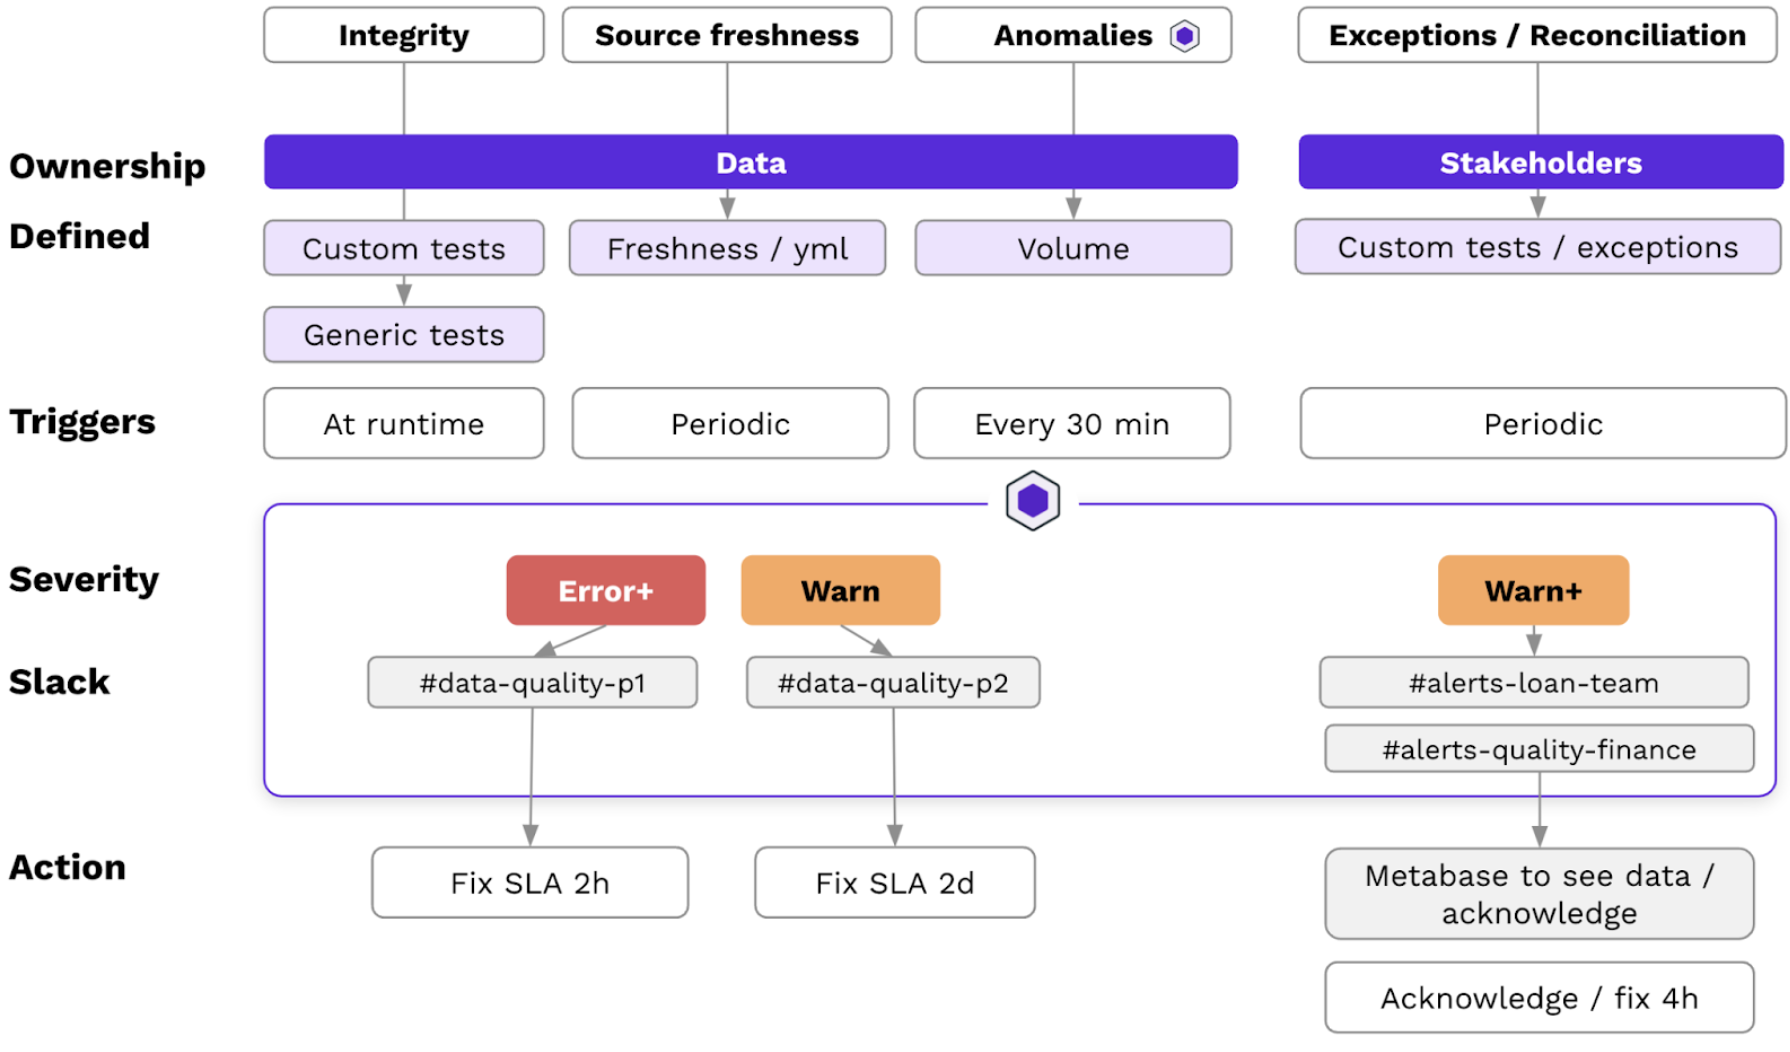
These tests validate new loans against the downstream data models in real-time. Synq automatically routes alerts to the responsible teams based on severity when discrepancies are detected. For example, a high-severity alert is sent immediately to a senior stakeholder who can escalate. Lower-priority issues are routed to operational staff.
This development process helps create a scalable workflow and audit trail. Alert recipients can dig into the specific data differences in Metabase and mark issues as acknowledged, fixed, or acceptable one-off differences.
The reconciliation and data quality system was built by the LendInvest data team.
Executive and regulatory reporting
It’s never a good look for the data team to have data issues impact core business KPIs and not notice them before stakeholders. This leads to incorrect decisions and causes stakeholders to lose trust in the data team.
But in fintech, the stakes are higher. KPIs may be used as key risk indicators, such as detecting breaches in the capital requirement liquidity ratio where issues have to be escalated to the board and regulators and can lead to multi-million dollar fines in addition to bad customer outcomes.
Challenge: Business-critical KPIs where 100% accuracy is needed
KPIs in fintech are metrics that help them measure their performance, monitor their financial health, and assess the effectiveness of their operations. The specific KPIs that are most relevant can vary depending on the business model, goals, and focus areas. Here are some commonly used ones.
- Gross transaction volume (GTV): GTV measures the total value of transactions processed through a fintech platform. It is particularly relevant for payment processors and platforms handling financial transactions.
- Risk metrics: Depending on the fintech’s focus (e.g., lending or investment), risk-related KPIs such as the default rate, loan-to-value ratio, or investment portfolio performance may be crucial.
- Regulatory compliance metrics: These metrics ensure that the fintech company complies with relevant financial regulations. They may include the number of regulatory violations, fines incurred, or the time to address compliance issues.
- Fraud detection and prevention metrics: Metrics related to detecting and preventing fraudulent activities, such as the number of fraudulent transactions detected or false positives, are important for financial controls.
Many fintech companies operate at a scale with hundreds or thousands of tables, and it’s not uncommon for each of the core KPIs to rely on hundreds of upstream tables and sources. This makes them prone to errors and increases the time it takes to resolve issues.
Challenge: Inconsistencies for historical data for regulatory reporting
When you have to resubmit the data to regulators you last submitted six months ago, one of the most painful issues is when the data in your data warehouse doesn’t match the data you shared six months ago. Hundreds of things could have gone wrong since then, and there’s often no way of reproducing these. At best, this is a bad look for your team, and at worst, it can mean that your company gets a sizeable fine or is subjected to additional reviews.
Solution: Build reliable KPIs by taking an end-end approach to data quality
Start by being clear about your KPIs and keep this in one place so everyone has a shared understanding.
Tip: A good starting point is in the yml file in your dbt project, as these properties can quickly be surfaced in other tools.
Specify your core KPIs
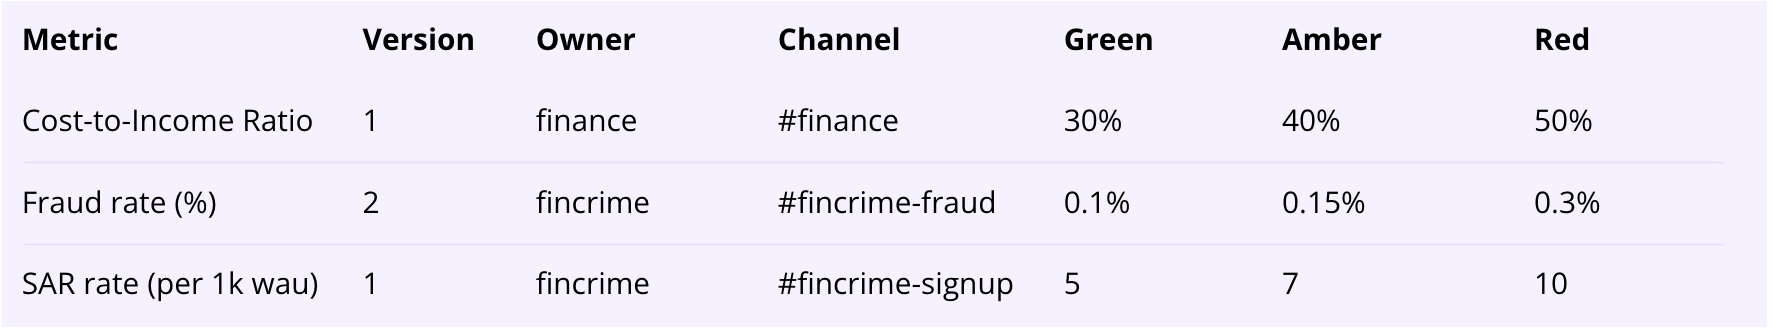
Define your core metrics with clear thresholds such as red, green, and amber levels, version tracking, and ownership. It provides a consistently understood framework for evaluating risk and escalation paths. Additionally, the red, green, and amber levels indicate when performance or risk exceeds, meets, or falls below expectations, allowing for quick identification of issues and escalations to the relevant stakeholders.
Core KPIs defined with version, owner, Slack channel, and escalation thresholds
Tip: Use check-model-tags from the pre-commit dbt package to enforce that each data model or metric has relevant metadata such as owner or version defined.
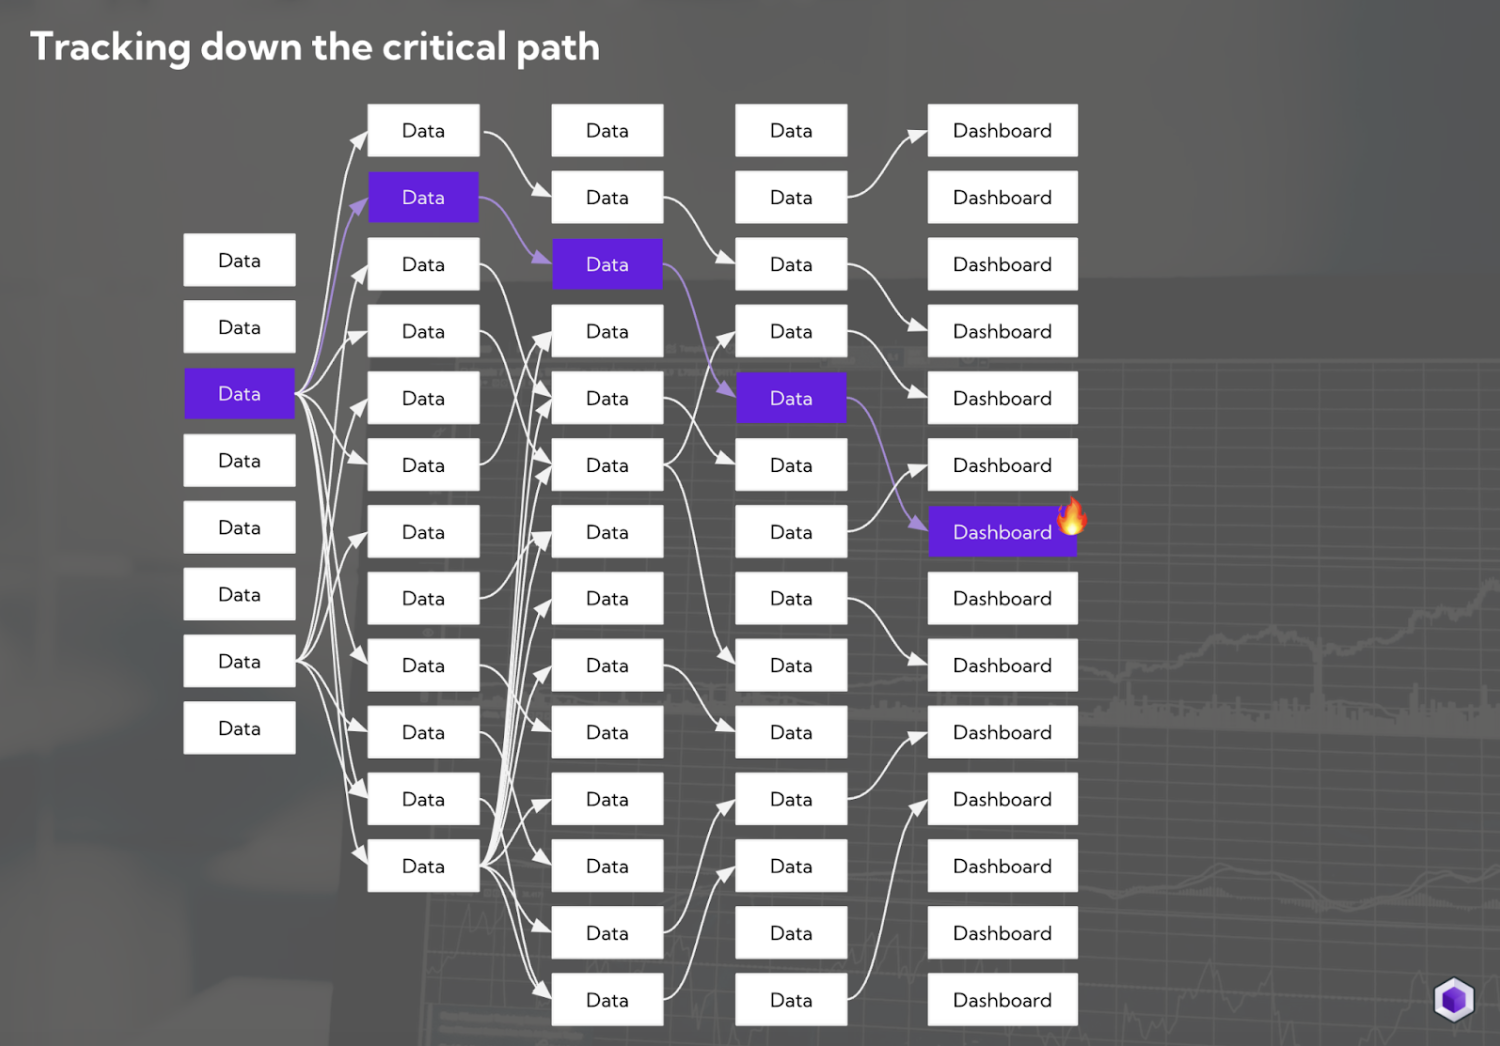
Test downstream data marts and their upstream dependencies.
It’s often not enough to know if there’s an issue in the downstream data model that exposes metrics to your BI tool. You should also test for data issues on upstream tables, as these can help you detect issues you may otherwise be blind to, such as a faulty join that causes you to run an aggregate function on duplicate rows. Any issue on a data asset upstream of business-critical KPIs is on the critical path and should be treated as such.
Step 1: Ensure that sources have fresh data
We recommend you use dbt source freshness tests when you have explicit expectations of when data should be refreshed and want to encode it as an SLA that is agreed with the business.
Sometimes, a delay in your data may be tolerable, but if a threshold is breached, it has a direct business impact. In these cases, we recommend you define severity depending on how late the data is. For example, if data is late by 12 hours, you can raise a warning, but if data is late by 24 hours, raise an error.
Automated freshness checks can complement your dbt source freshness checks if you don’t know the exact threshold, are unaware of it, or failed to anticipate a freshness check was needed.
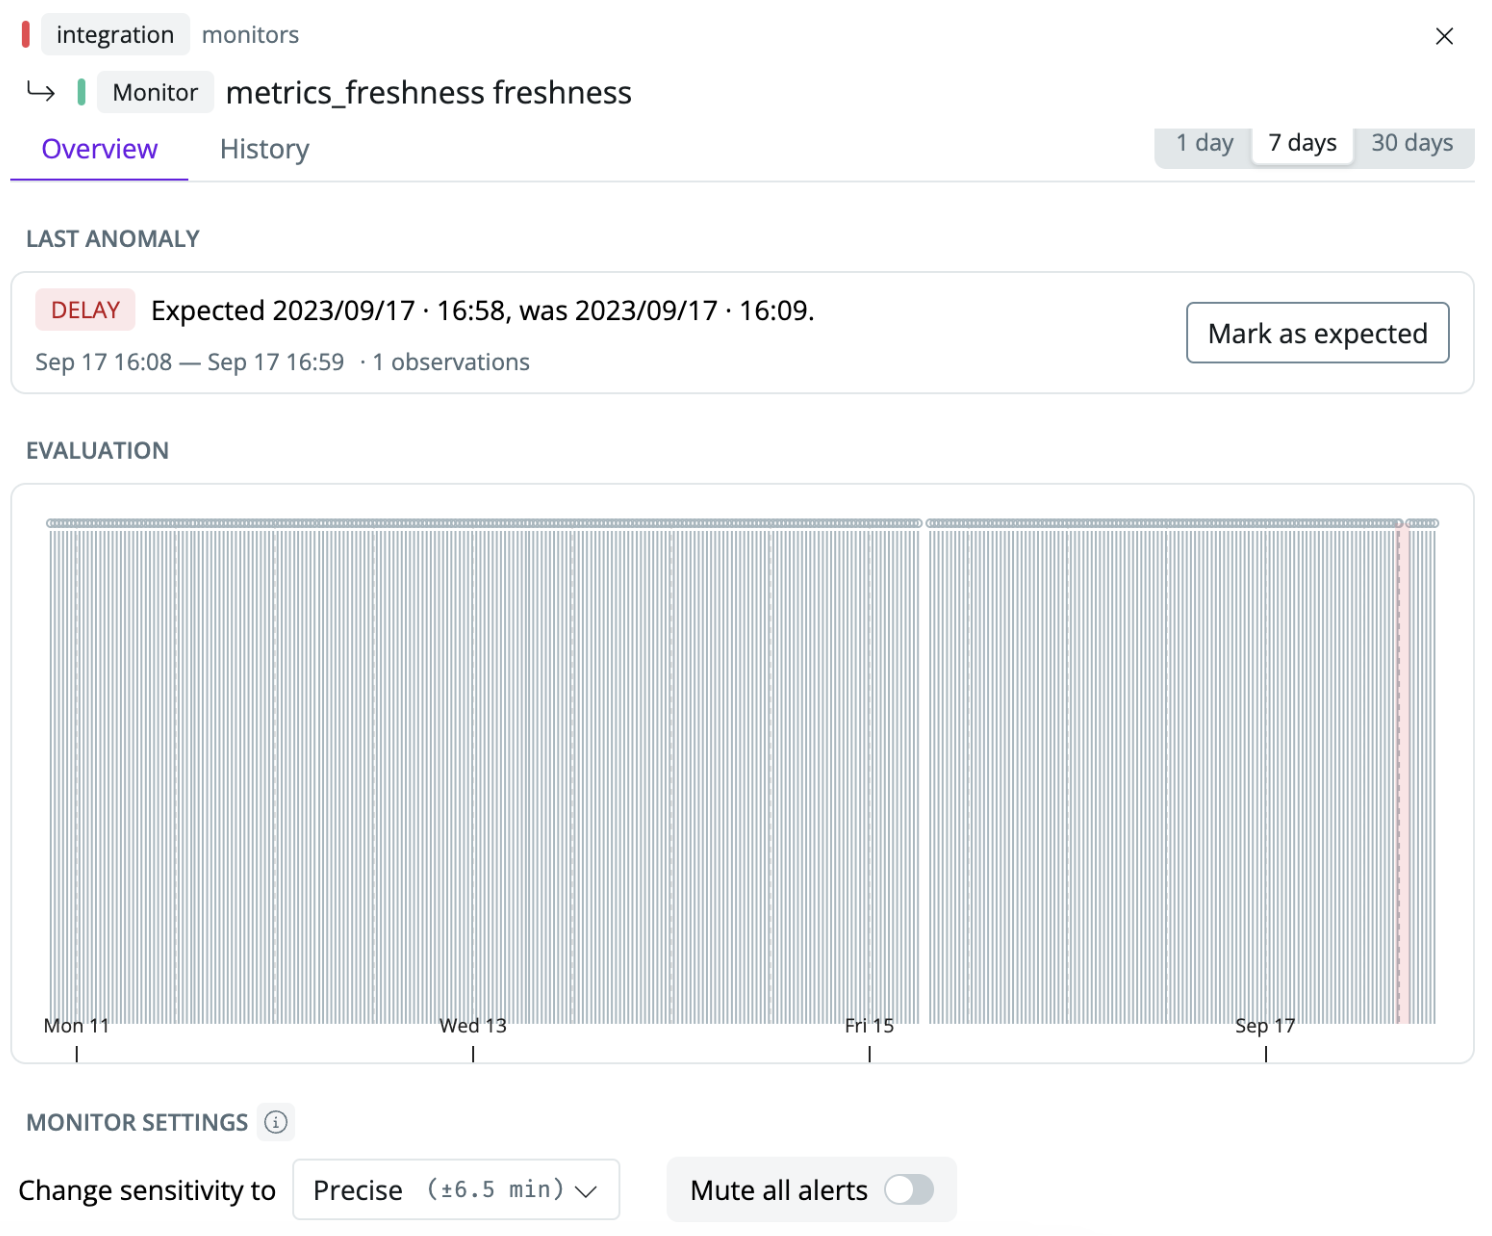
With a data observability tool, you can automatically monitor if tables are fresh. A tool like Synq automatically pulls data such as information_schema last modified dates for warehouses such as Snowflake and BigQuery and learns the expected refresh patterns of your data to detect when your data starts arriving later than usual. As the tests query the information schema, you only incur minimal additional costs even when they are run frequently.
An example from an automated freshness monitor from Synq that has learned the expected interval at which new data should arrive
Step 2: Test data quality on all tables on the critical path
At the most basic level, you should start by adding relevant generic tests to your important data models. dbt has four generic tests (uniqueness, not_null, accepted_values, and relationships) that come out of the box and can be deployed with minimal configuration.
In most cases, we recommend, at a minimum, adding uniqueness and not_null tests for important models. Uniqueness helps detect no duplicate values or recurring rows in a dataset. not_null should be used in cases where empty or null values are indicative of a data issue.
Step 3: Use anomaly monitors on tables on the critical path
Even when you have a well-tested data pipeline with freshness checks and data quality checks from dbt, you may still be blind to more nuanced issues. For example, it’s easy to overlook a sudden shift in the row count. We recommend you add self-learning monitors to check the row count on all tables on the critical path.
One of the benefits of using an observability tool for checking for row counts is that it automatically learns the seasonal and trend behaviors of your data. If you have an end-of-month spike in gross transaction volume around payday, the model will incorporate this and not flag it as an anomaly once you’ve fed that information back.
Volume monitor in Synq that has learned the seasonality of the data
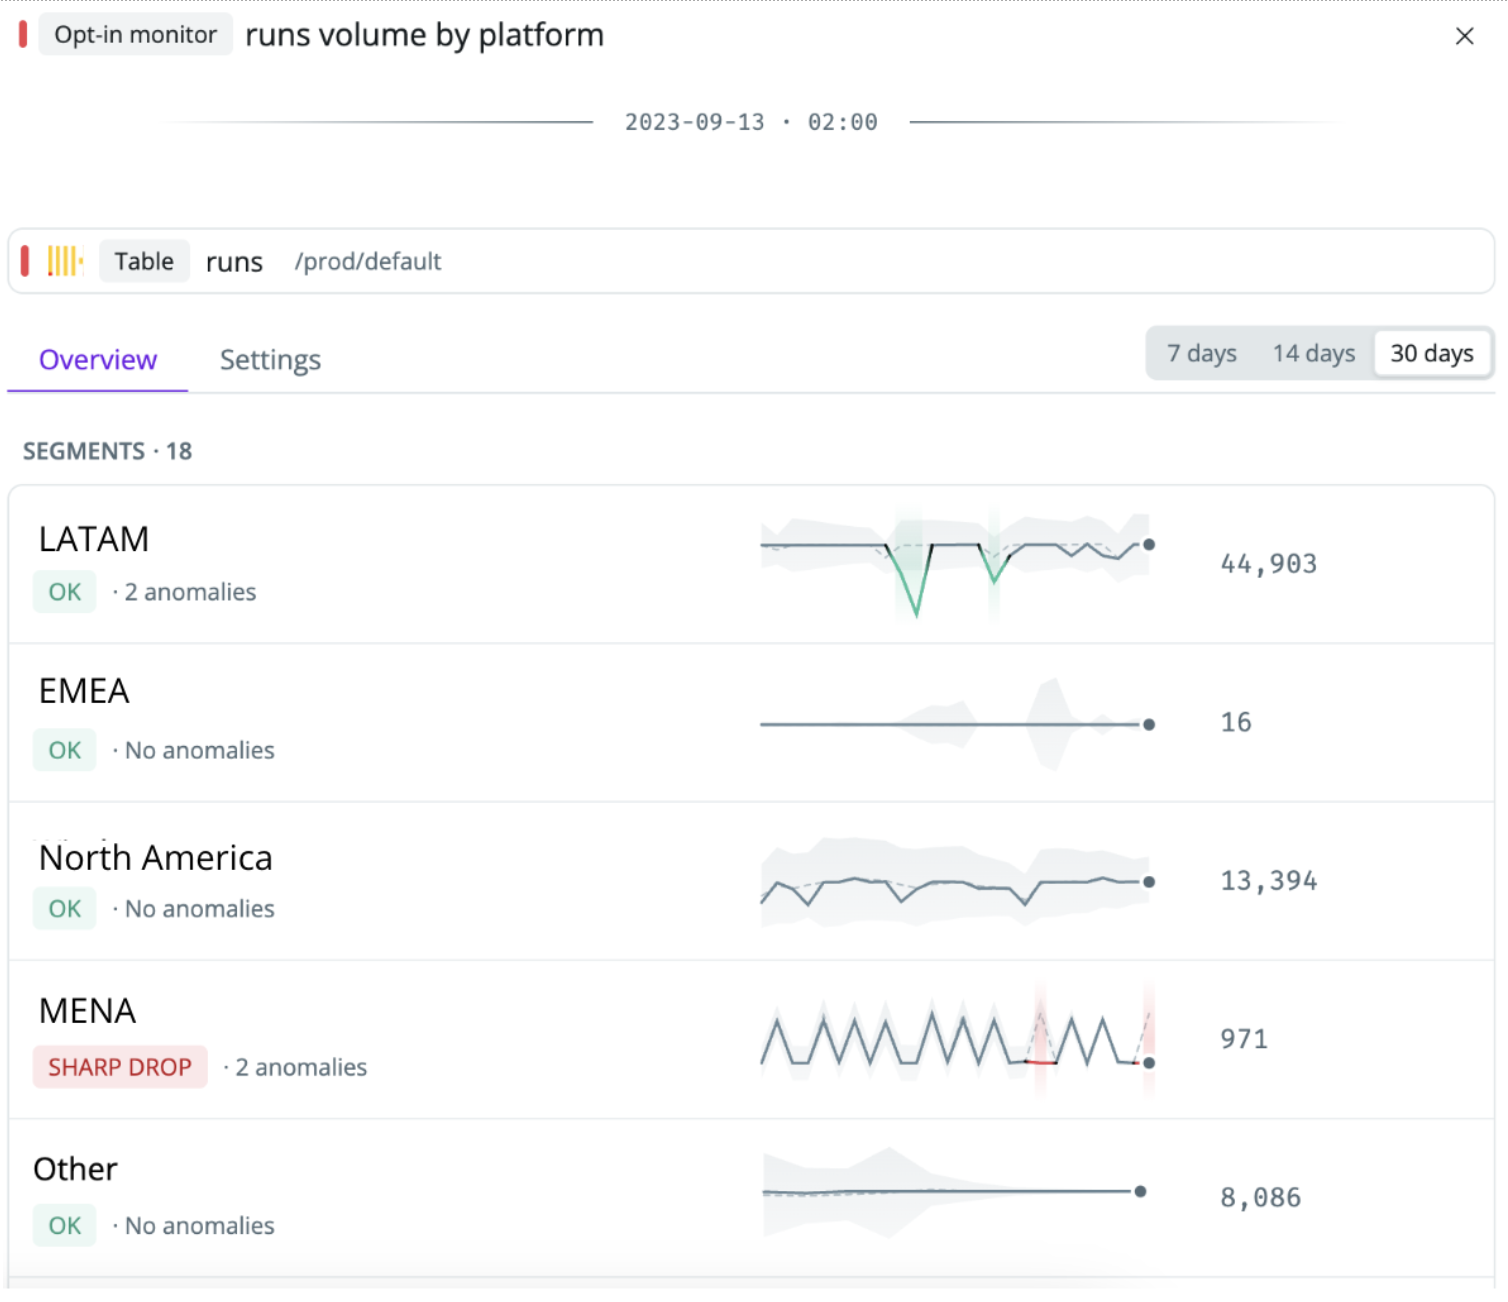
Step 4: Monitor row count for different segments for downstream tables
In some cases, more than table-level row count monitors may be required. For example, a lending platform uses multiple KYC providers to validate users from different regions, and an issue with a provider may only impact users in one region, which can be harder to detect. Custom monitors by segment automatically learn the volume patterns of each region and detect if the row count of one segment is behaving unexpectedly.
Example from Synq of a row count monitor automatically monitoring each geographic region.
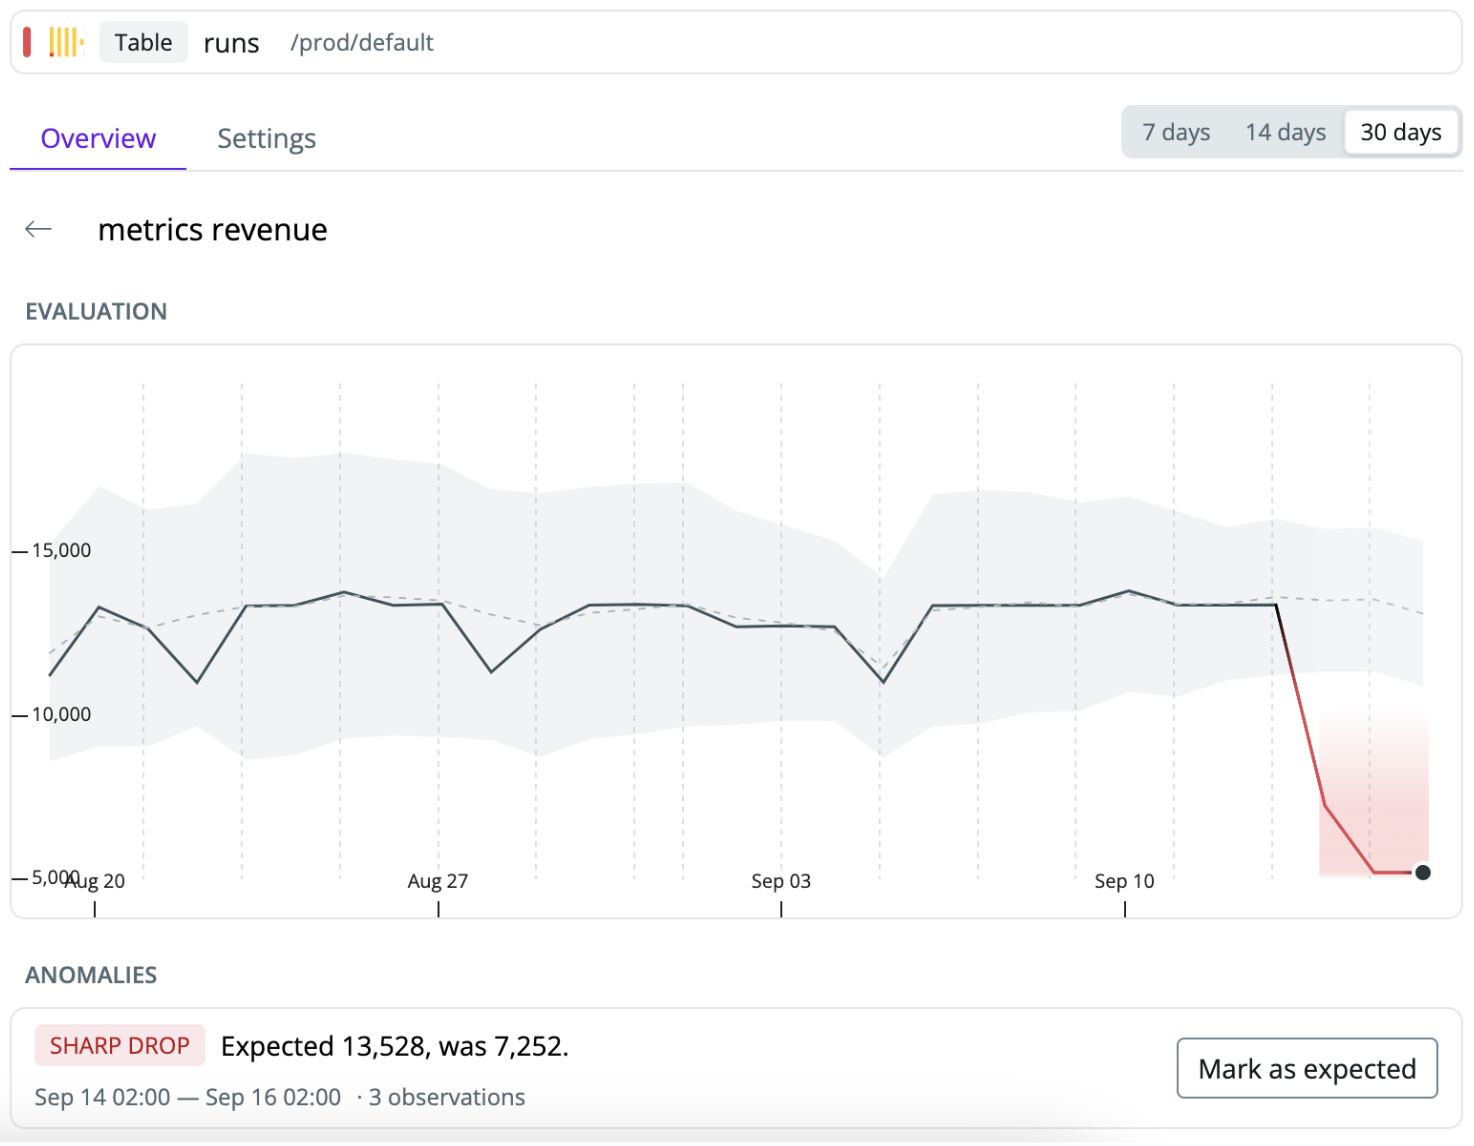
Step 5: Detect unexpected changes in key metrics
With dozens or hundreds of KPIs, it can be difficult for end-users to spot if there’s a significant change in a metric that they should pay attention to.
While the fraud rate may vary over time, a jump from 1% to 5% is unexpected. With value-based monitors on the fraud rate metric, you’ll proactively know if there’s a sudden spike so you can investigate the root cause and prevent downstream impact.
Tip: Applying these monitors should be carefully managed, and if you already have existing red, green, and ambers thresholds in place, you may be better served by using these.
Solution: Regression tests to catch historical outliers
There are many ways to add regression tests, ranging from advanced implementations, such as automatically creating snapshots, to more basic approaches by comparing data to a fixed point in time.
If you’re like most data teams, you’re likely not doing much here, and we recommend starting with the most basic version of regression tests on a handful of key metrics.
Here’s an example implementation from a data team for flagging when the sum of a column up to a given date changes, meaning that historical data has changed.
/*
Arguments:
- column_name: Picked up from the context it's used in
- model: Picked up from the context it's used in
- date: The date used for the historical data check
- date_column: Which column the date is in
- expected_sum: The value this column should total to on / up to the given date
- up_to_date: Boolean which indicates whether to sum up to and including (<=) the date, or on (=) just the given date
- rounded_to_decimal_places: Optional INT, checks the expected_sum is correct up to the given precision
*/

{%- test expected_sum_at_date(column_name, model, expected_sum, date, date_column, up_to_date, rounded_to_decimal_places) -%}

{# Flag if we want to sum to up and including the date (<=), or on the date (=) #}
{%- if up_to_date -%}
{%- set operator = '<=' -%}
{%- else -%}
{%- set operator = '=' -%}
{%- endif -%}

{# Check the expected_sum value up to the specified decimal places #}
{%- if rounded_to_decimal_places %}
{%- set aggregation = 'ROUND(CAST(SUM(' ~ column_name ~ ') AS NUMERIC), ' ~ rounded_to_decimal_places ~ ')' -%}
{%- else -%}
{%- set aggregation = 'CAST(SUM(' ~ column_name ~ ') AS NUMERIC)' -%}
{%- endif -%}

SELECT
{{ aggregation }} AS actual_sum

FROM {{ model }}
WHERE {{ date_column }} {{ operator }} '{{ date }}'
HAVING {{ aggregation }} != {{ expected_sum }}

{%- endtest -%}
Example of implementing the test
- expected_sum_at_date:
    expected_sum: 250000
    date: "2022-08-31"
    date_column: "day"
    up_to_date: True
    severity: error
Automated decisioning
Leading fintech companies use machine learning models to reduce risk, improve cost, and streamline the customer experience. Some examples of automated decisioning systems are
- Lending and credit decisions: Automated decisioning to assess the creditworthiness of borrowers quickly. Analyze an applicant’s financial data, credit history, and other relevant information to determine whether to approve or deny a loan application and to set appropriate interest rates and credit limits.
- Underwriting and risk assessment: Automated underwriting systems evaluate the risk associated with insurance policies, loans, or other financial products. They use data-driven models to assess risk factors and determine the pricing and terms of financial products.
- Fraud detection: Automated decisioning is crucial for detecting fraudulent transactions and activities in real-time. Machine learning systems on transaction data can identify patterns indicative of fraud.
- Customer onboarding: Automated decisioning to simplify and expedite the customer onboarding process. This includes verifying customer identities, conducting KYC checks, and assessing the risk associated with new customers.
Challenge: Reliable machine learning system predictions
An advanced fraud detection system can prevent customers from being scammed of $10,000s of their hard-earned money and significantly reduce the money the fintech has to repay customers. Machine learning systems and real-time transaction monitoring can automatically watch every financial interaction, instantly identifying and flagging suspicious activity.
As companies transition to relying on automated detection systems for business processes such as fraud and transaction monitoring, the importance of the reliability of these systems increases.
In the case of an ML system to detect fraudulent behaviors, it’s not uncommon for this to rely on hundreds of data models such as user demographics, 3rd-party systems, product usage, and transaction data. Combined, this means that comprehensive end-end monitoring is a must to deliver reliable predictions.
Example of an ML-based fraud detection system with the data warehouse at the center
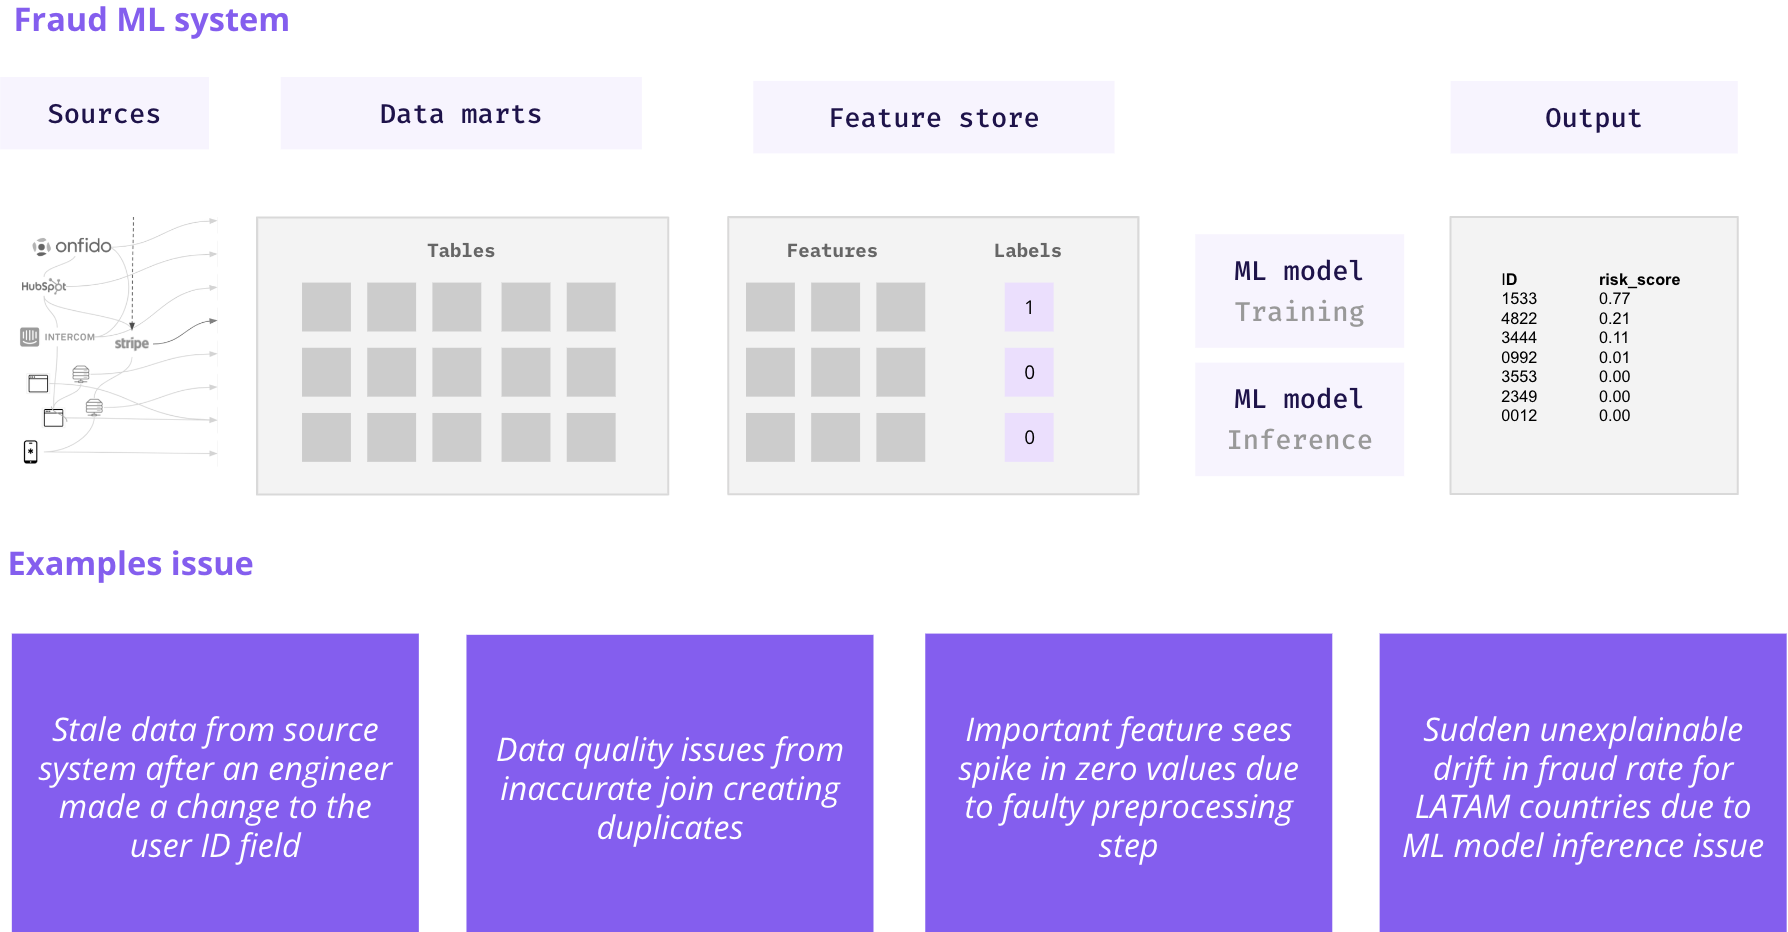
Machine learning systems can be a black box, and uncaught issues may mean that the wrong customers get declined by automated onboarding controls or that the company fails to detect fraud directly impacting customers.
Solution: End-end observability of ML system to build quality by design
First, it’s essential to consider if the ML model is being trained on accurate data. A common issue that can happen to the training data is data drift, where the statistical properties of the data used to train a model change over time, leading to a decrease in model performance.
Issues in the model output can also happen due to problems in the ML training or inference steps and should simultaneously be monitored.
ML monitoring is a broad topic. Many tools and techniques exist to measure model performance metrics and understand when issues arise, such as model drift, model performance decay, model outliers, and data quality. The following steps focus on monitoring data quality, but a dedicated ML monitoring system may be a needed supplement for some systems.
Step 1: Ensuring robust input data by building quality by design
Well-tested data pipelines can help you detect issues feeding into the ML model training set before they impact the model predictions.
- Freshness checks to catch stale data: Apply dbt source freshness checks for data sources when you explicitly expect data to be refreshed. Supplement these with automated freshness checks from an observability tool for sources where you don’t know the exact threshold or if you’re unaware of or failed to anticipate a freshness check was needed.
- Use generic tests on the critical path: Test early and often for core quality issues such as uniqueness and not_null to detect issues as close to the source as possible.
- Field level metrics: Apply automated field level monitors from your observability tool on your most important features. For example, automatically monitor changes in the percentage of values in a column with a zero value or % of null values, which can introduce errors into the model predictions.
Tip: It can be helpful to run data quality checks regularly, even if you retrain your model less frequently, to catch issues as close as possible to when they happen
Step 2: Proactively detect erroneous output data
We recommend monitoring the output if your ML system is trained and runs inference frequently. Even if you have no upstream issues impacting your training data, issues in core training or inference steps can still mean you’re outputting inaccurate predictions.
- Field level monitors: Field level monitors such as % zero or null values can help you detect apparent issues in the values output by your ML system.
- Monitor by segments: In some cases, you can be blind to if the model starts drifting for a specific segment, such as suddenly increasing the risk rating predicted for users signing up from LATAM countries. Custom monitors by relevant segments can help detect this.
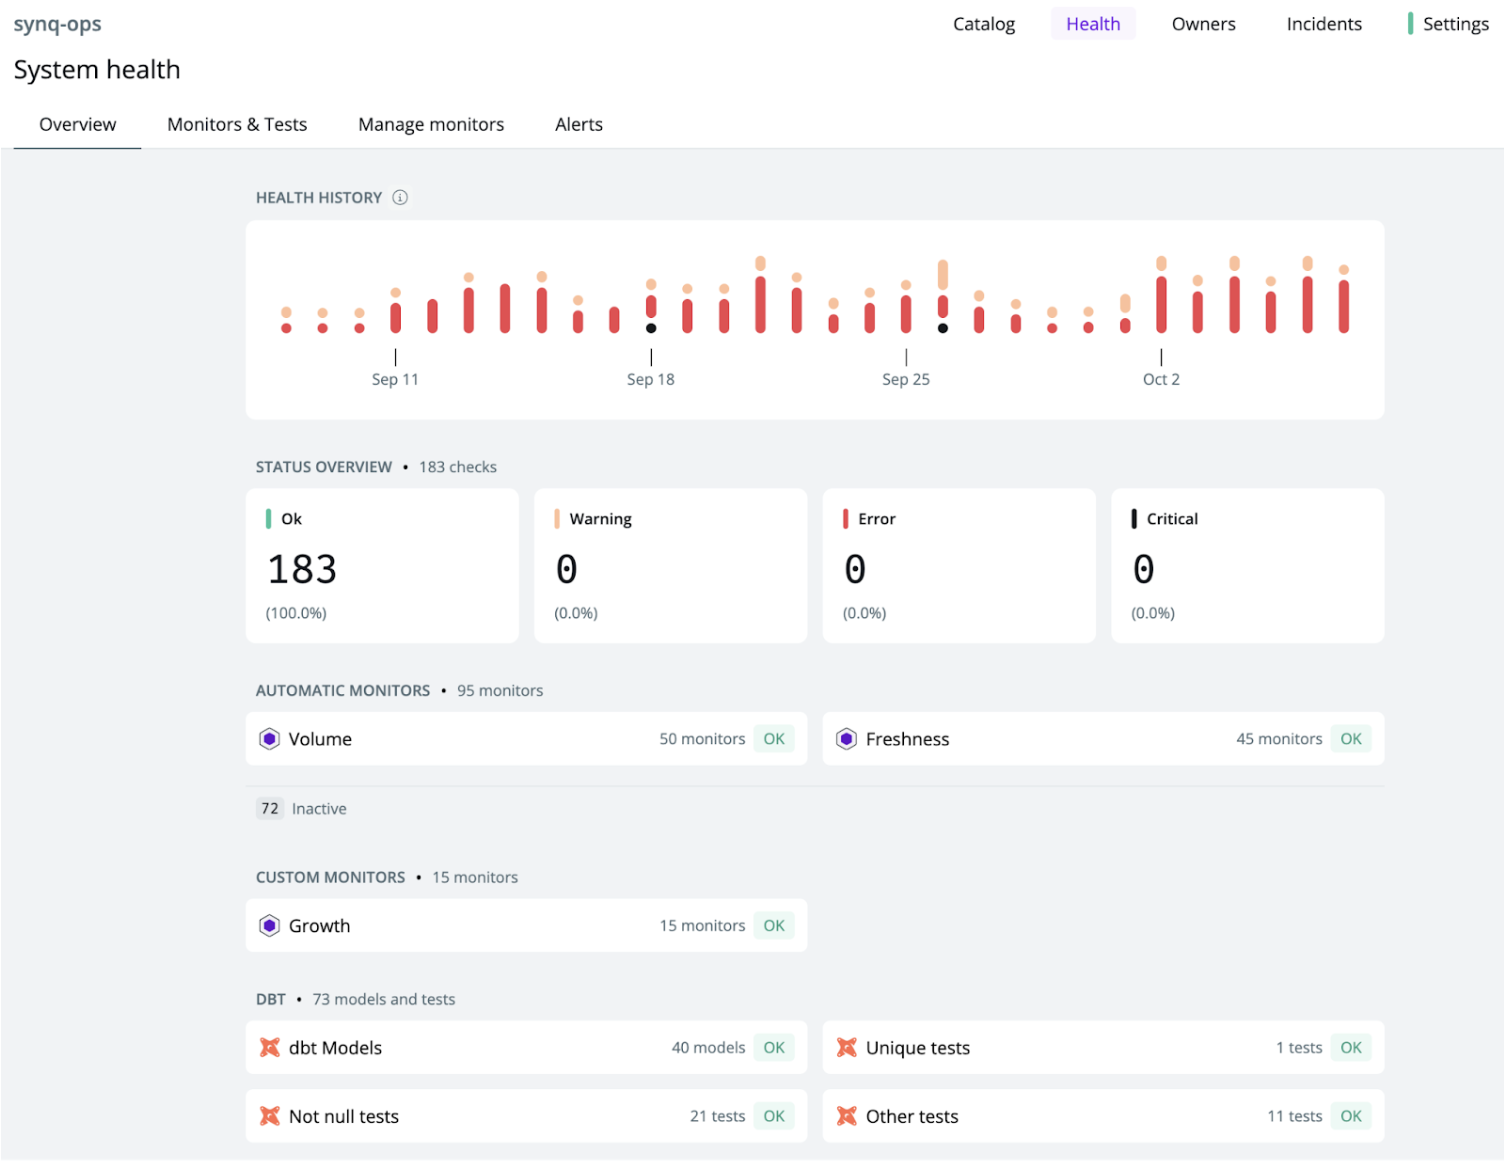
It can also be a requirement to report on the uptime and historical issues for each automated decisioning system. This type of information may be required for regulators and can help build trust with other engineering teams with expectations around production system monitoring.
System health monitoring in Synq tracking historical uptimes and errors by type
Customer experience, KYC & onboarding
Challenge: Fast iteration cycles are needed for rapid experimentation
Balancing the need for thorough identity verification with a smooth onboarding experience is a delicate task, as it requires collecting a wealth of information without overwhelming the customer.
Many fintechs have hundreds of thousands or millions of active users, which makes them prime candidates for running experiments such as A/B tests. For example, alter the steps in the signup flow and measure the impact on signup rates while also taking into account health metrics such as % of users that sign up are fraudulent to increase the proportion of new users that successfully sign up.
“An experiment is an isolated change you expose to some but not all of your users. You keep running the experiment until you’re sure of your result (also called statistical significance), at which point you know exactly what the impact of the change is.”
Running experiments efficiently often involves making many small product changes. Being able to capture these in your data warehouse and having accurate data to assess the impact of the changes on your North Star metrics is key. If you operate in an experiment-based culture, you may run multiple weekly tests. Therefore, your data team must be able to operate quickly and resolve data issues as fast as possible.
“We want to build a world where any data scientist can have an idea on the way to work and explore it end-to-end by midday.” - Monzo
Solution: Free up your data team with efficient issue-resolution workflows
Data teams often spend over 20% of their time working reactively and resolving data issues. As your team and data stack scale, this number tends to grow, which slows down data scientists and can create frustrations within the team.
With the right combination of processes and tooling, you can reduce this number significantly.
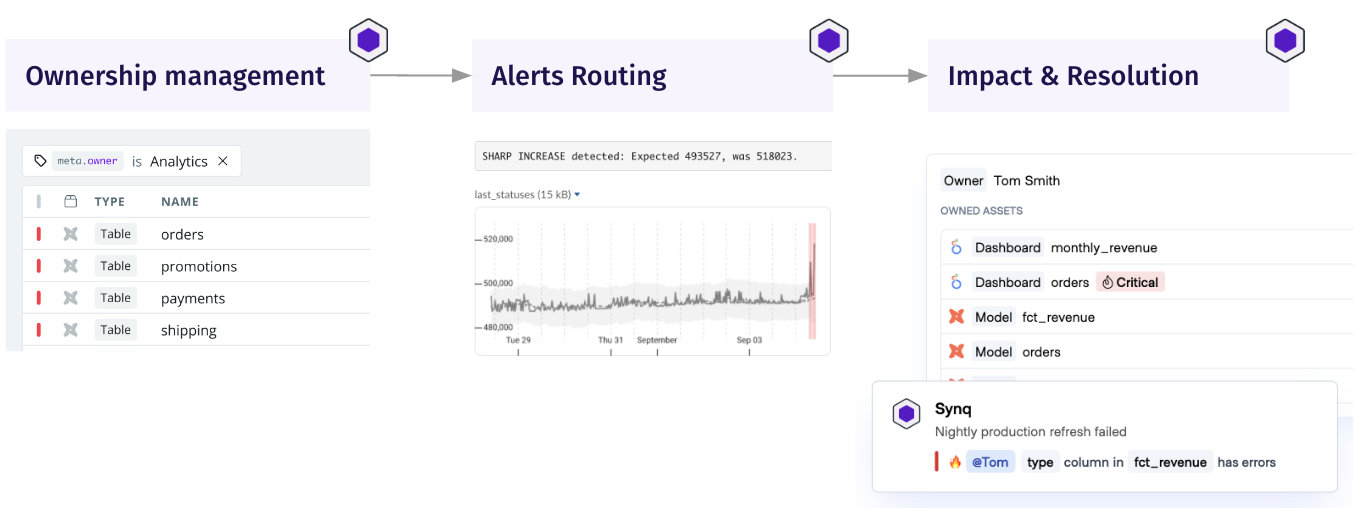
Alerting and notification: Optimise your notification systems so that when data quality issues are detected, these are sent to the relevant owner with the information that makes them able to triage or solve the issue as fast as possible. Read more about our recommendations for how to optimise your alerting workflow.
Root cause analysis & incident management: Establish clear guidelines for addressing data issues and managing incidents. See our guide Incident management for data teams for tactical steps on incident management.
Unified ownership, alerting, and impact & resolution management in Synq
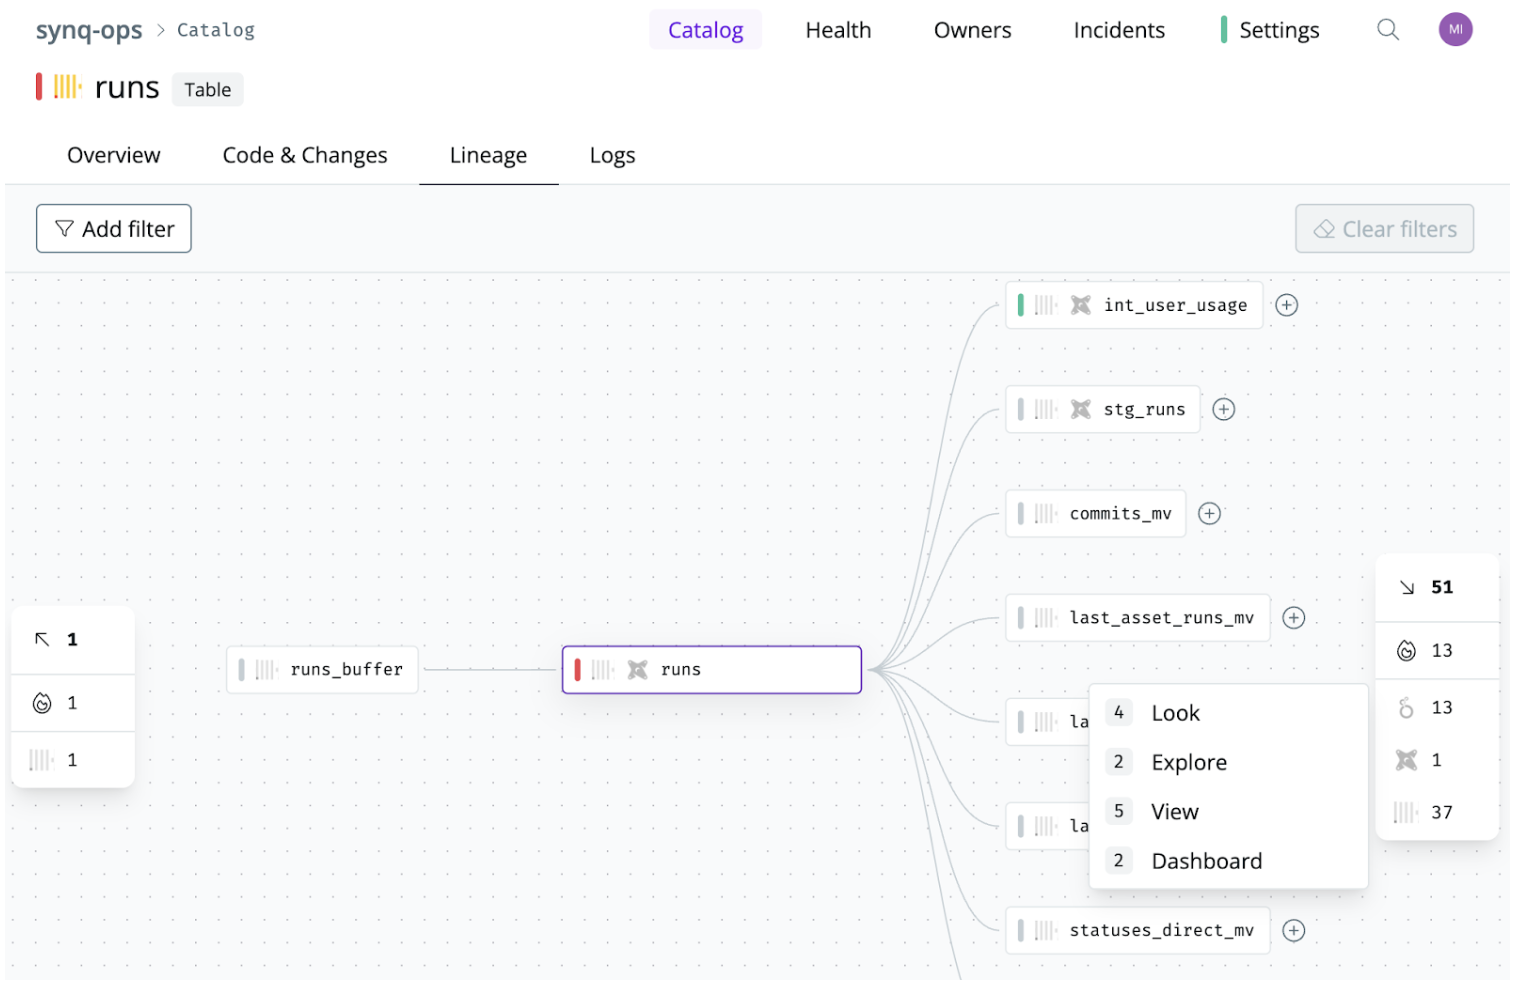
Data lineage and tracking: With end-end lineage, from source systems to your BI tool, you can quickly track data changes and understand the impact on downstream applications.
“Manually maintaining hundreds of exposures in dbt to Looker was not feasible anymore. We needed this to happen automatically and in real-time” - UK fintech.
Automated source to BI, column-level lineage in Synq
Summary
In this article, we’ve looked at the top challenges faced in fintech and some steps you can take to overcome them. A consistent theme in fintech is the reliance on data for truly business-critical processes and the costly consequences when data issues go undetected.
- Reconciliation: Fintech companies often face challenges in data reconciliation, where multiple source systems may lead to inconsistencies and require automation for accuracy. LendInvest is a prime example of how to build an automated reconciliation system that brings together data producers and the data team.
- Key KPIs and regulatory reporting: Ensuring the accuracy of core KPIs is key for regulatory compliance and sound decision-making. We recommend clear metric definitions and end-end monitoring across the critical path to catch issues proactively.
- Automated decisioning: Leading fintech companies use automated decisioning for fraud detection and customer onboarding, where data accuracy is paramount for success. Observability across input and output metrics helps build more reliable systems and prevents costly issues.
- Customer experience & KYC: Providing a seamless and efficient customer experience is a key goal for fintechs, and data quality plays a crucial role in achieving this. The best trade-off between financial controls and customer onboarding is often discovered through experiments. Clearly defined processes and tooling help speed up incident and issue resolution workflows and allow the data team to run more experiments.

.png)
.png)