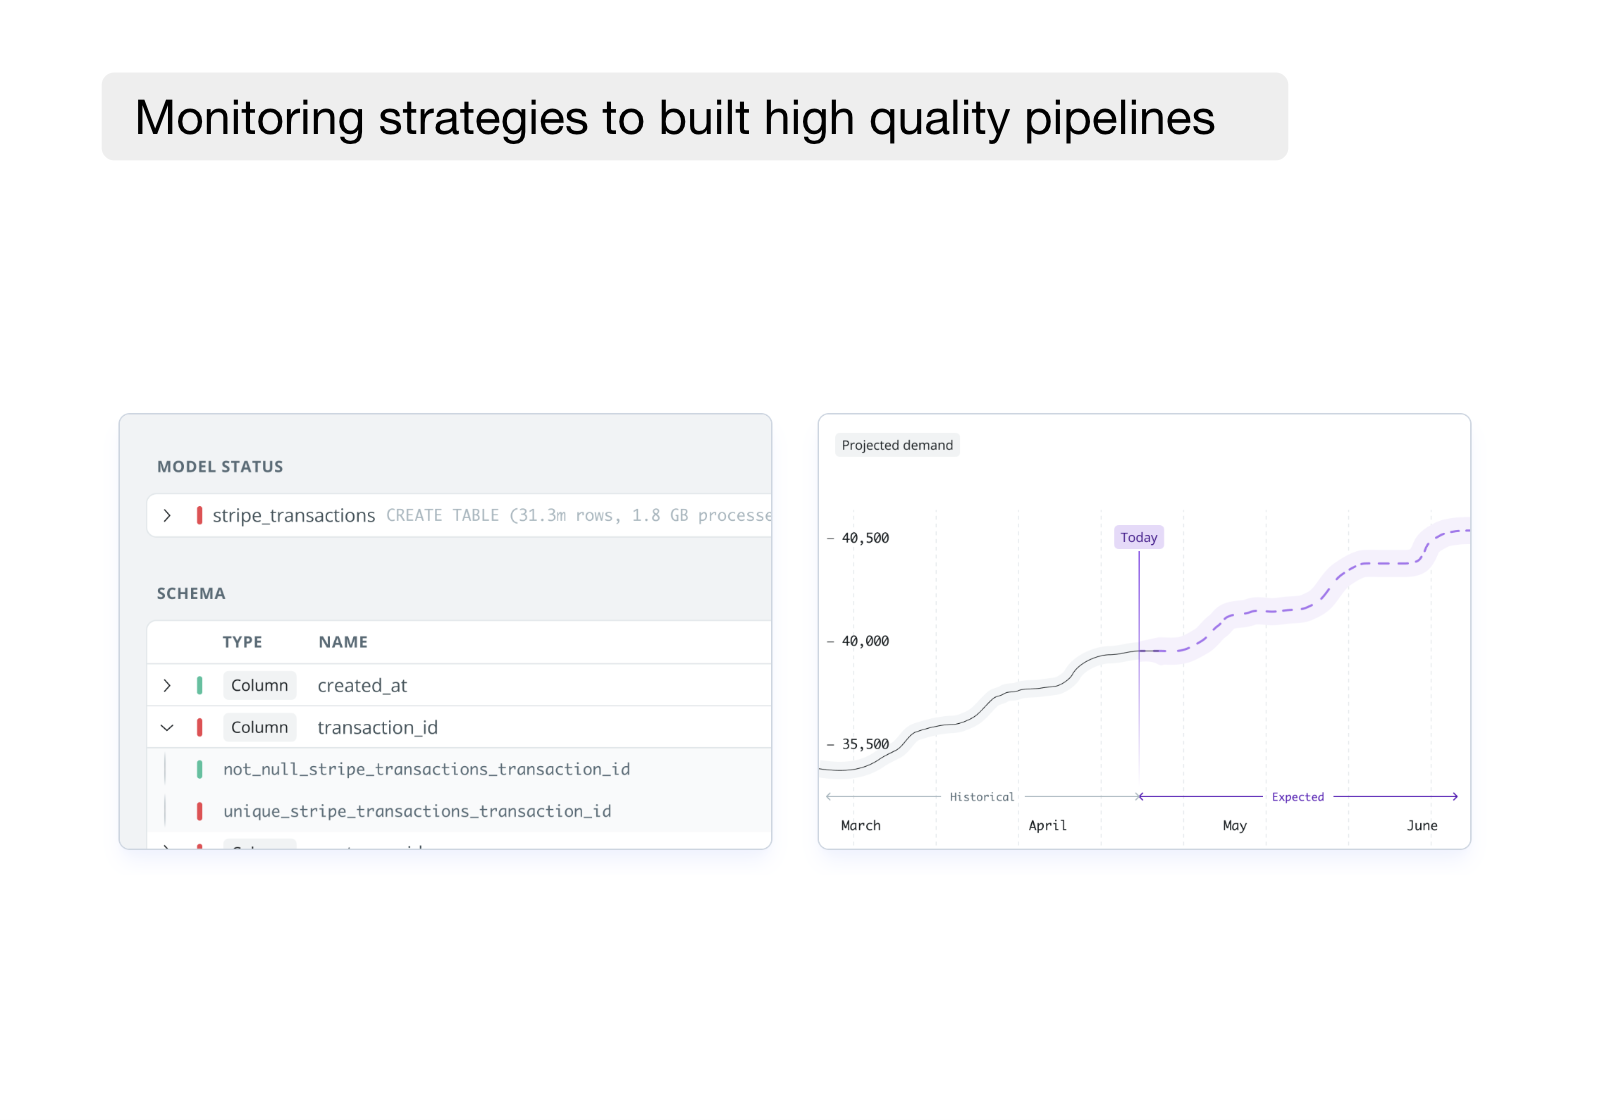
Anomaly monitors and dbt tests to ensure the data quality

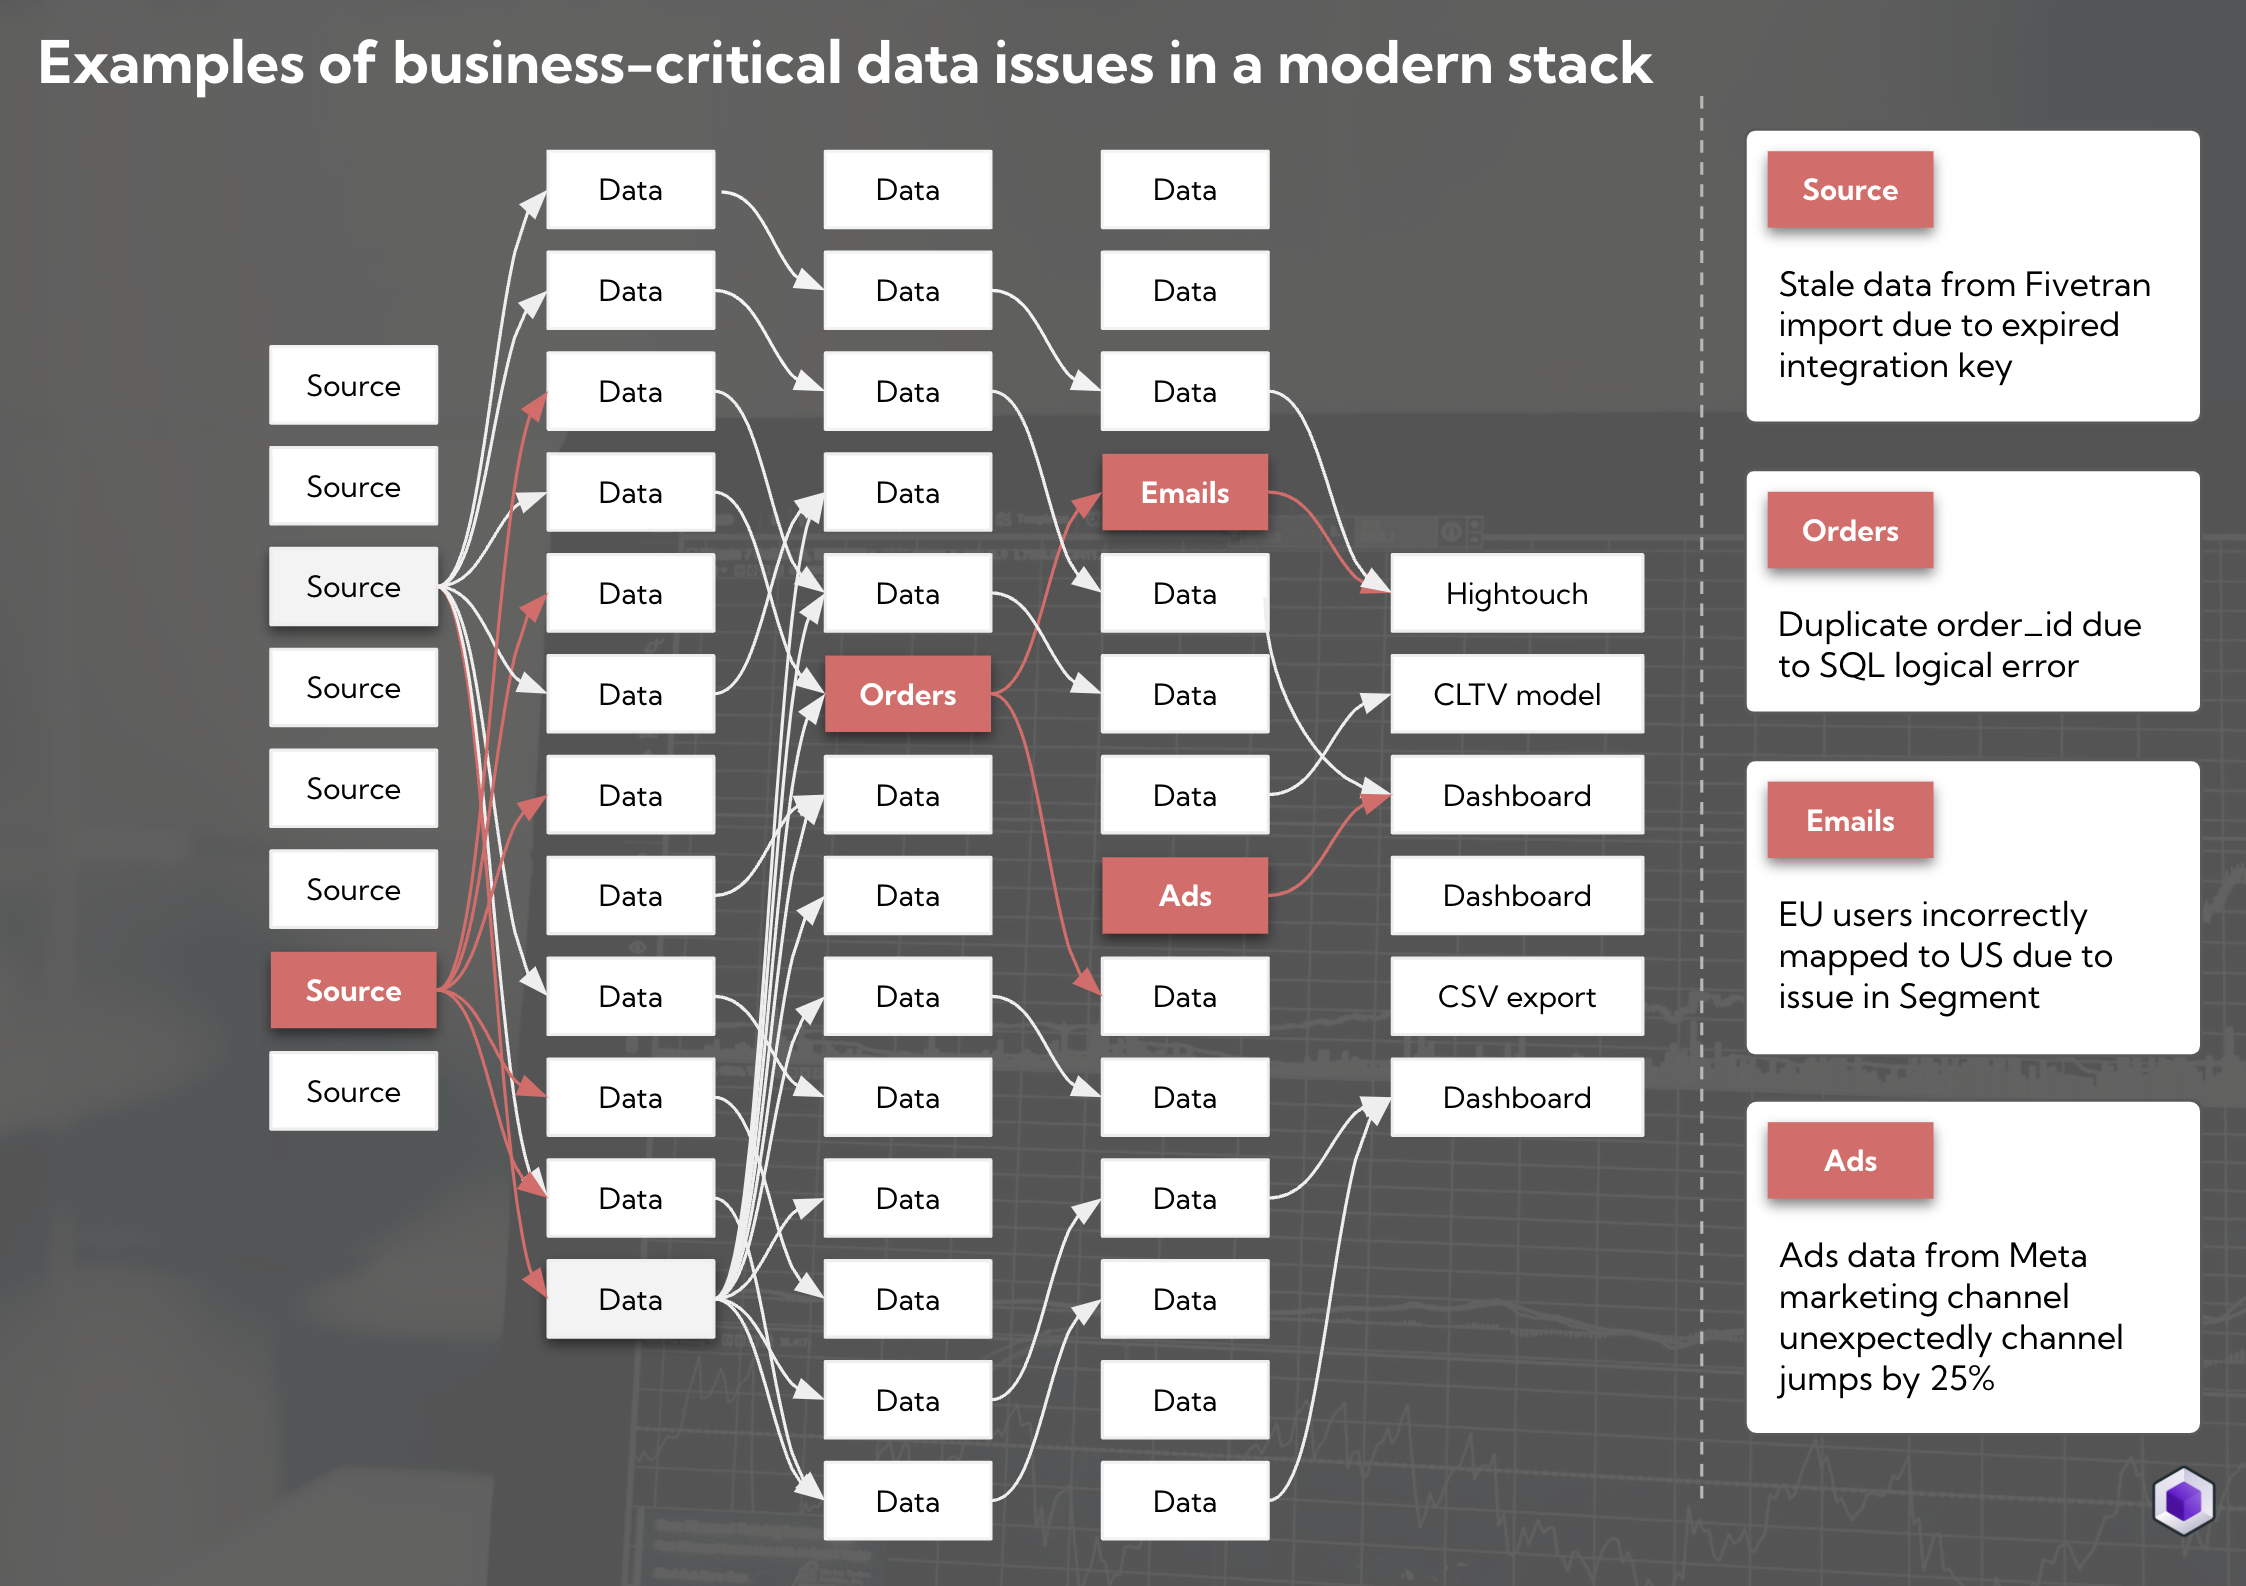
Not all data issues are created equal. While some issues may be merely annoying other issues spark hire-on-fire-moments causing your company to bleed $100,000 each day.
At SYNQ, we work with dozens of companies that are seeing an explosion in business-critical data use cases. A few years ago data was used for ‘finger-in-the-air’ decision-making but today the data warehouse is powering business-critical operations such as a Hightouch sync determining which customers to send emails to, value-based spend allocation to marketing platforms and automated pricing models to decide what to purchase products for.
This has increased the expectations of data, SLAs are now required for core pipelines, and teams are incorporating on-call rotas which were formerly only used in traditional engineering disciplines. dbt has played a leading role in giving analytics engineers the tooling needed to express expectations of their data in terms of deterministic tests.
But while deterministic tests are good at catching known unknowns, we frequently hear data teams refer to their most painful incidents as unknown unknowns; issues they didn’t anticipate but with critical business impact.
Different types of issues you can encounter throughout your data stack
A future-proof data monitoring approach should combine dbt tests and anomaly monitors to deliver data pipelines that are suitable to power business-critical use cases.
As you extend your data quality checks, it’s important to be mindful of how you balance coverage and signal-to-noise ratio. Maximal monitoring across the stack may be appealing, but is rarely the best option as it can cause alert fatigue and wear out your data team causing important issues to get overlooked.
In this article, we’ll look into
- How to use dbt tests and source freshness checks to build robust pipelines
- Using freshness, volume, and distribution anomaly monitors to supplement dbt tests
- Steps you can take to make your monitoring strategy work at scale
Monitoring strategies to build end-end reliability
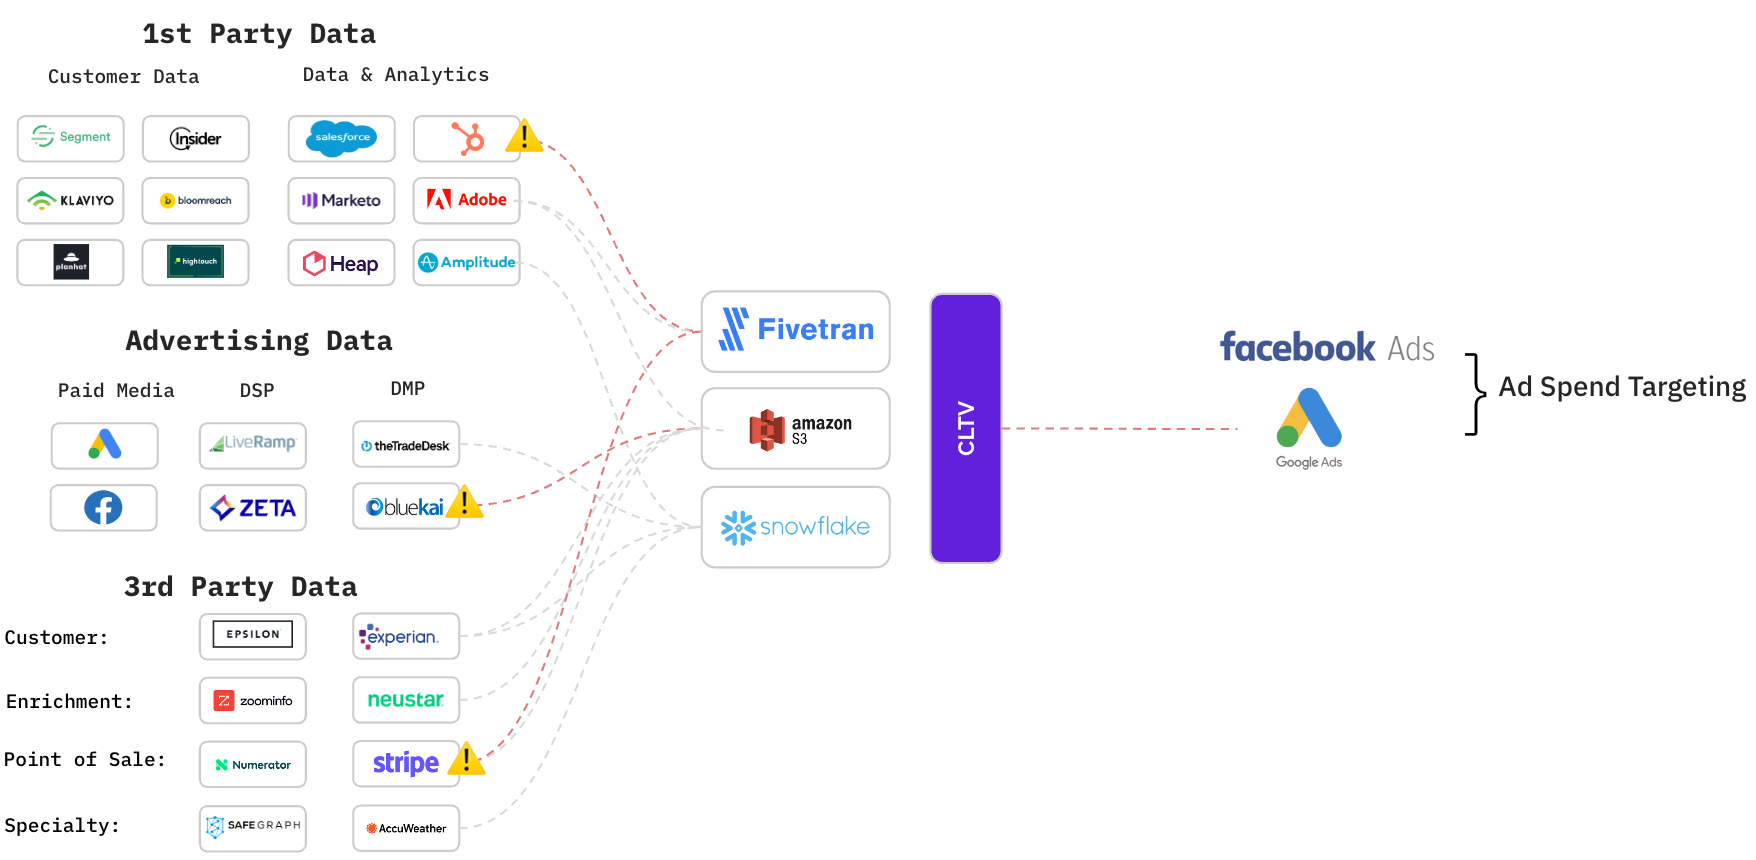
In the rest of this article, we’ll put ourselves in the shoes of an eCommerce company that relies on paid advertising for 50% of user acquisition. The company uses a customer lifetime value (CLTV) calculation to more accurately bid the right price for the right user.
“Our CLTV calculation broke due to an issue with a 3rd party data source. Not only did we lose some of the £100,000 we spent on Google that day but we also had to wait a few days for the CLTV model to recalibrate” - 500 person fintech
Historically, the pipeline has had issues that have since been partially covered by basic dbt tests. However, the marketing data team has experienced costly, uncaught issues that they want to catch proactively. To best possible guardrail against future issues, the team has identified the following scenarios that they want to be at the forefront of
- Source freshness: The team relies on more than 200 sources such as ad platform data ingested through funnel.io, and CRM data from SalesForce. It’s not uncommon for an integration to not load due to upstream issues with a 3rd party provider and catching these early is key
- Business expectations: The data marketing team has domain knowledge that they know should be true and that they want to incorporate into tests. For example, new customers must exist in both SalesForce and HubSpot so the sales team can contact high-potential signups directly
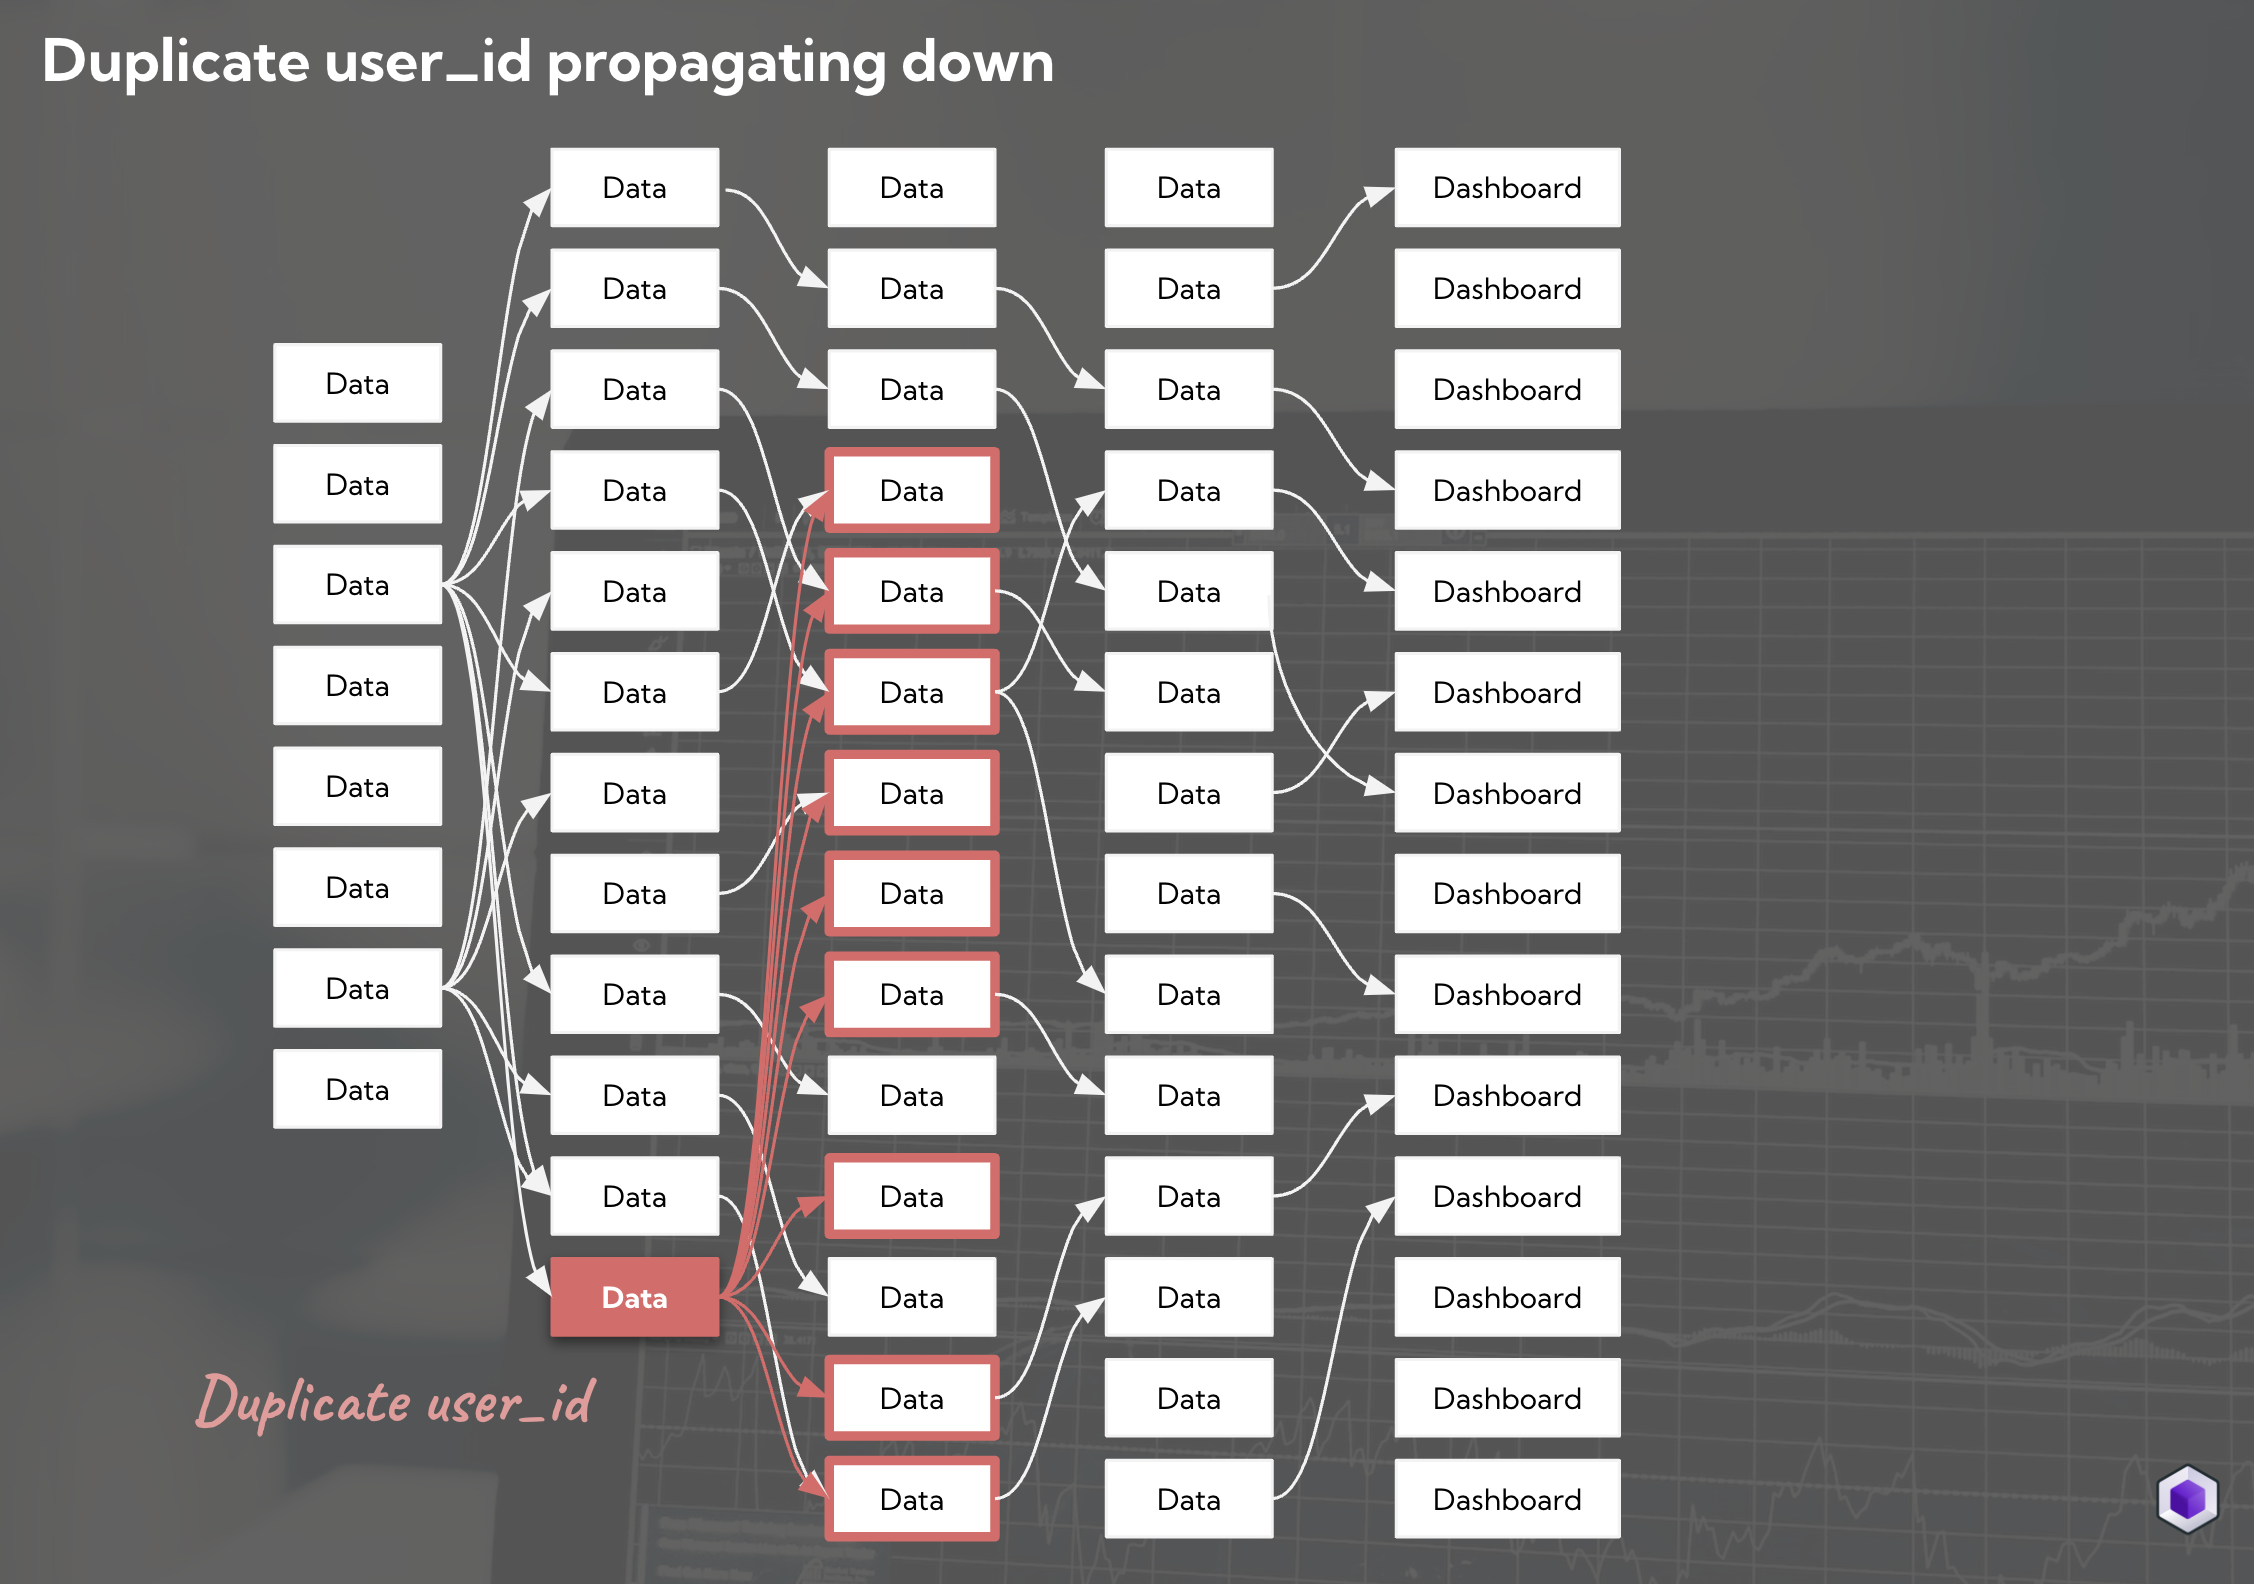
- Data quality checks: The CLTV data model consists of hundreds of upstream data models in dbt that transform data from raw events into a consolidated user view. From time to time an analytics engineer unintendedly introduces issues such as duplicate accounts or unintended null values
- Volume & distribution anomalies: The most difficult issues to catch are those that the team didn’t anticipate. Recently, the engineering team changed the mapping of events emitted through Segment causing the number of rows for one of their marketing channels to jump unexpectedly
In the following sections, we’ll look at specific monitoring strategies you can apply to overcome these challenges by combining dbt tests and anomaly monitors
Monitor freshness for data flowing to the warehouse
Freshness checks can help you track the duration since a table or column was last updated. While this may seem like table stakes, missing data is still the most common frustration stakeholders express.
Monitor freshness with dbt source freshness
We recommend you use dbt source freshness tests when you have explicit expectations of when data should be refreshed and want to encode it as an SLA that is agreed with the business.
In some cases, a certain delay in your data may be tolerable but if a threshold is breached it has a direct business impact. In these cases, we recommend you define severity depending on how late the data is. For example, if data is late by 12 hours you can raise a warning but if data is late by 24 hours, raise an error.
While dbt gives you the option to encode fixed expectations of the freshness of your sources, it can sometimes be difficult to define hardcoded expectations and find the right level for the acceptable amount of time to consistently raise relevant freshness errors.
Automated freshness monitoring
With a data observability tool, you can automatically monitor if tables are fresh. A tool like Synq automatically pulls data such as information_schema last modified dates for warehouses such as Snowflake and BigQuery and learns the expected refresh patterns of your data to be able to detect when your data starts arriving later than usual. As the tests query the information schema, you only incur minimal additional costs even when they are run frequently.
Automated freshness checks are an essential complement to your dbt source freshness checks if you don’t know what the exact threshold should be or if you’re unaware of or failed to anticipate a freshness check was needed.
To avoid a freshness issue in an upstream table creating data freshness issues in dozens of tables downstream, you can use the lineage from your observability tool to only place freshness checks at the most upstream tables to get one cohesive alert for a comprehensive analysis rather than disjointed alerts.
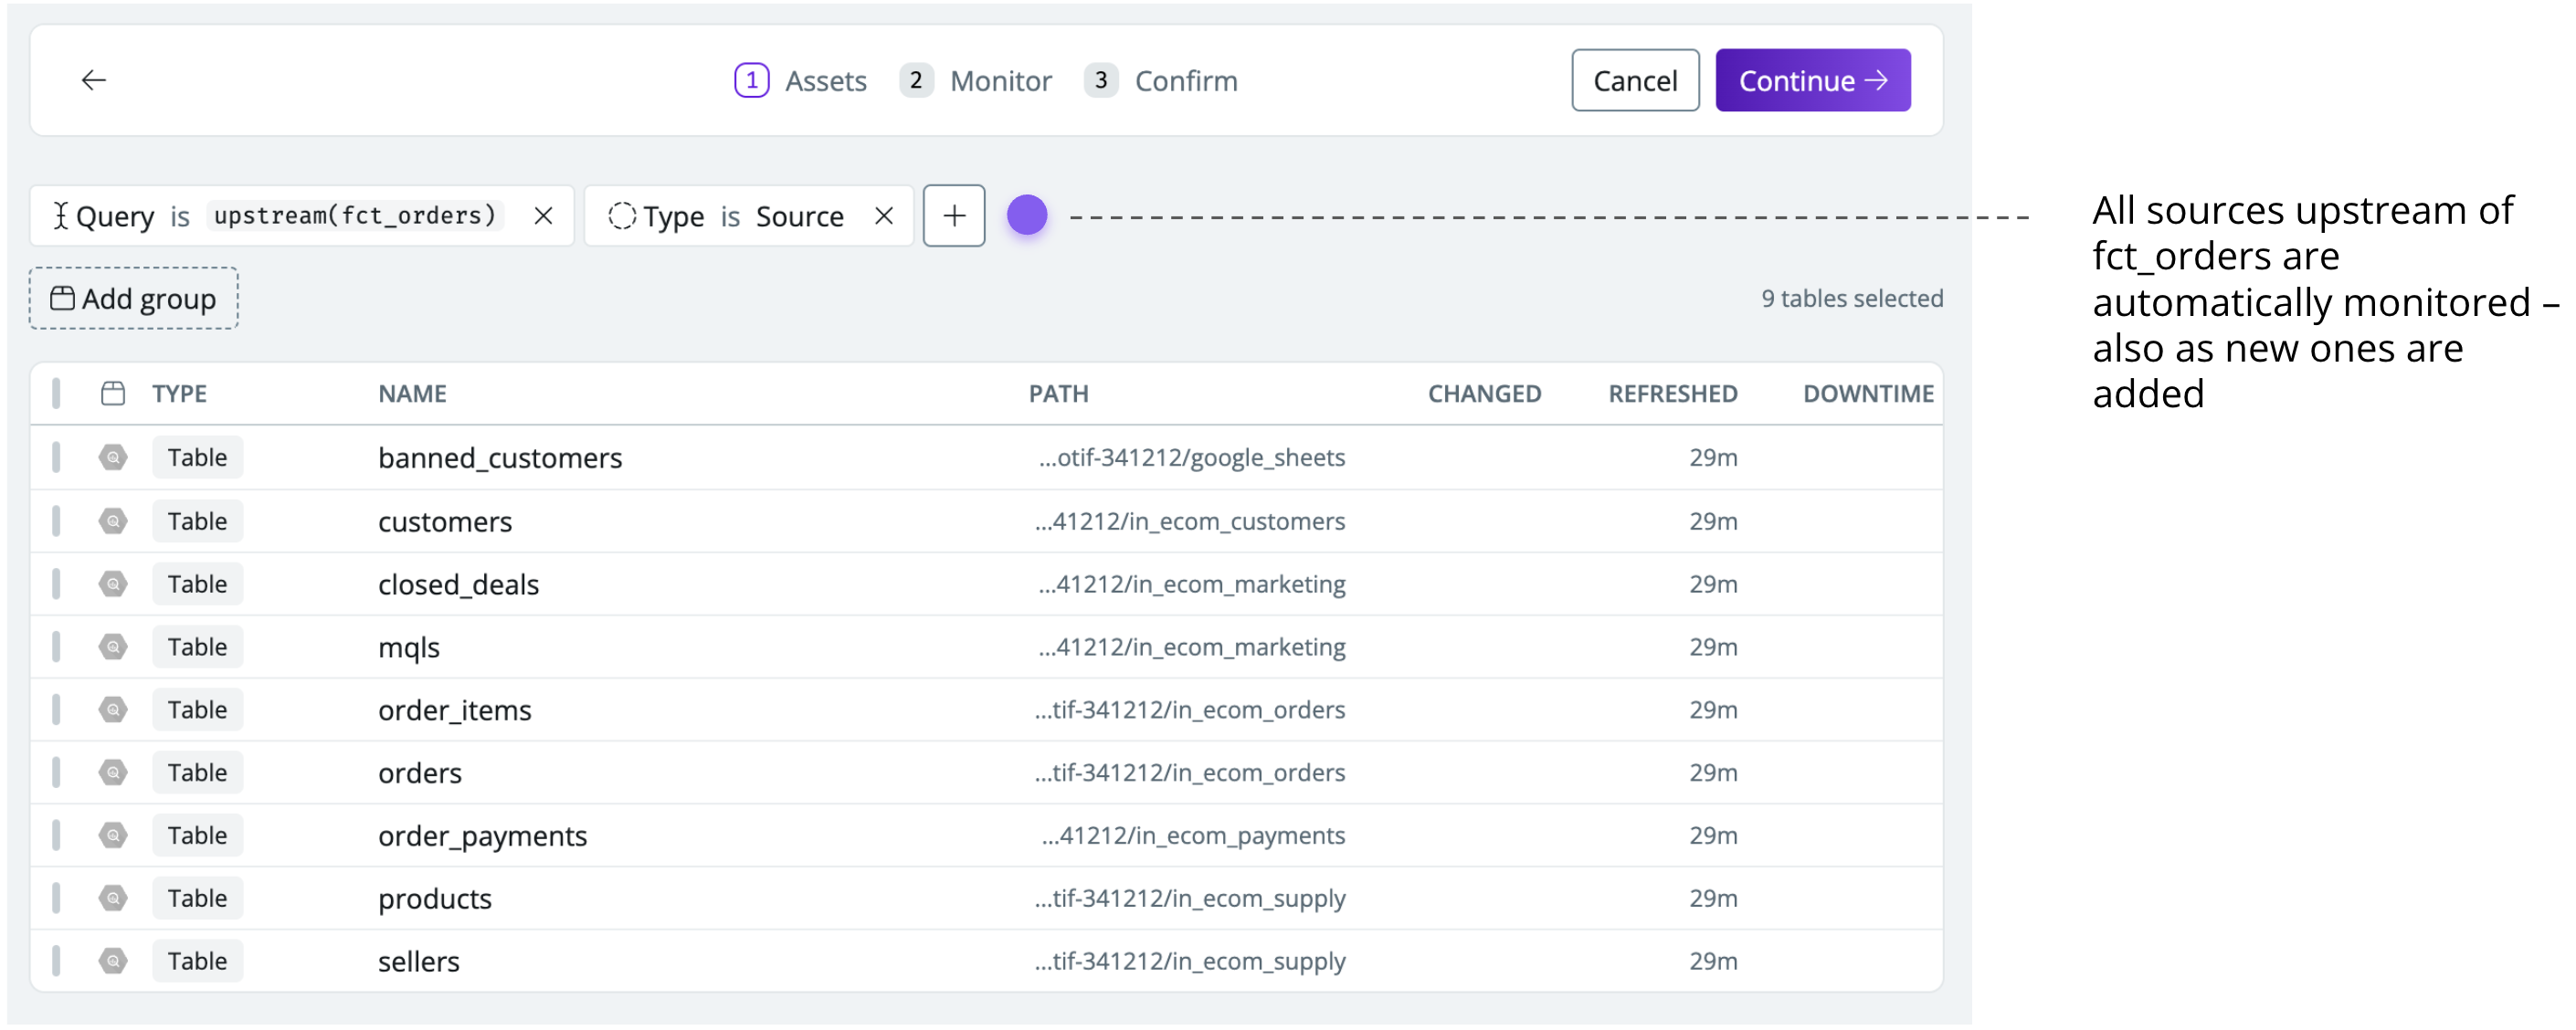
Synq can be configured to automatically monitor specific schemas with source tables so all new tables are automatically monitored
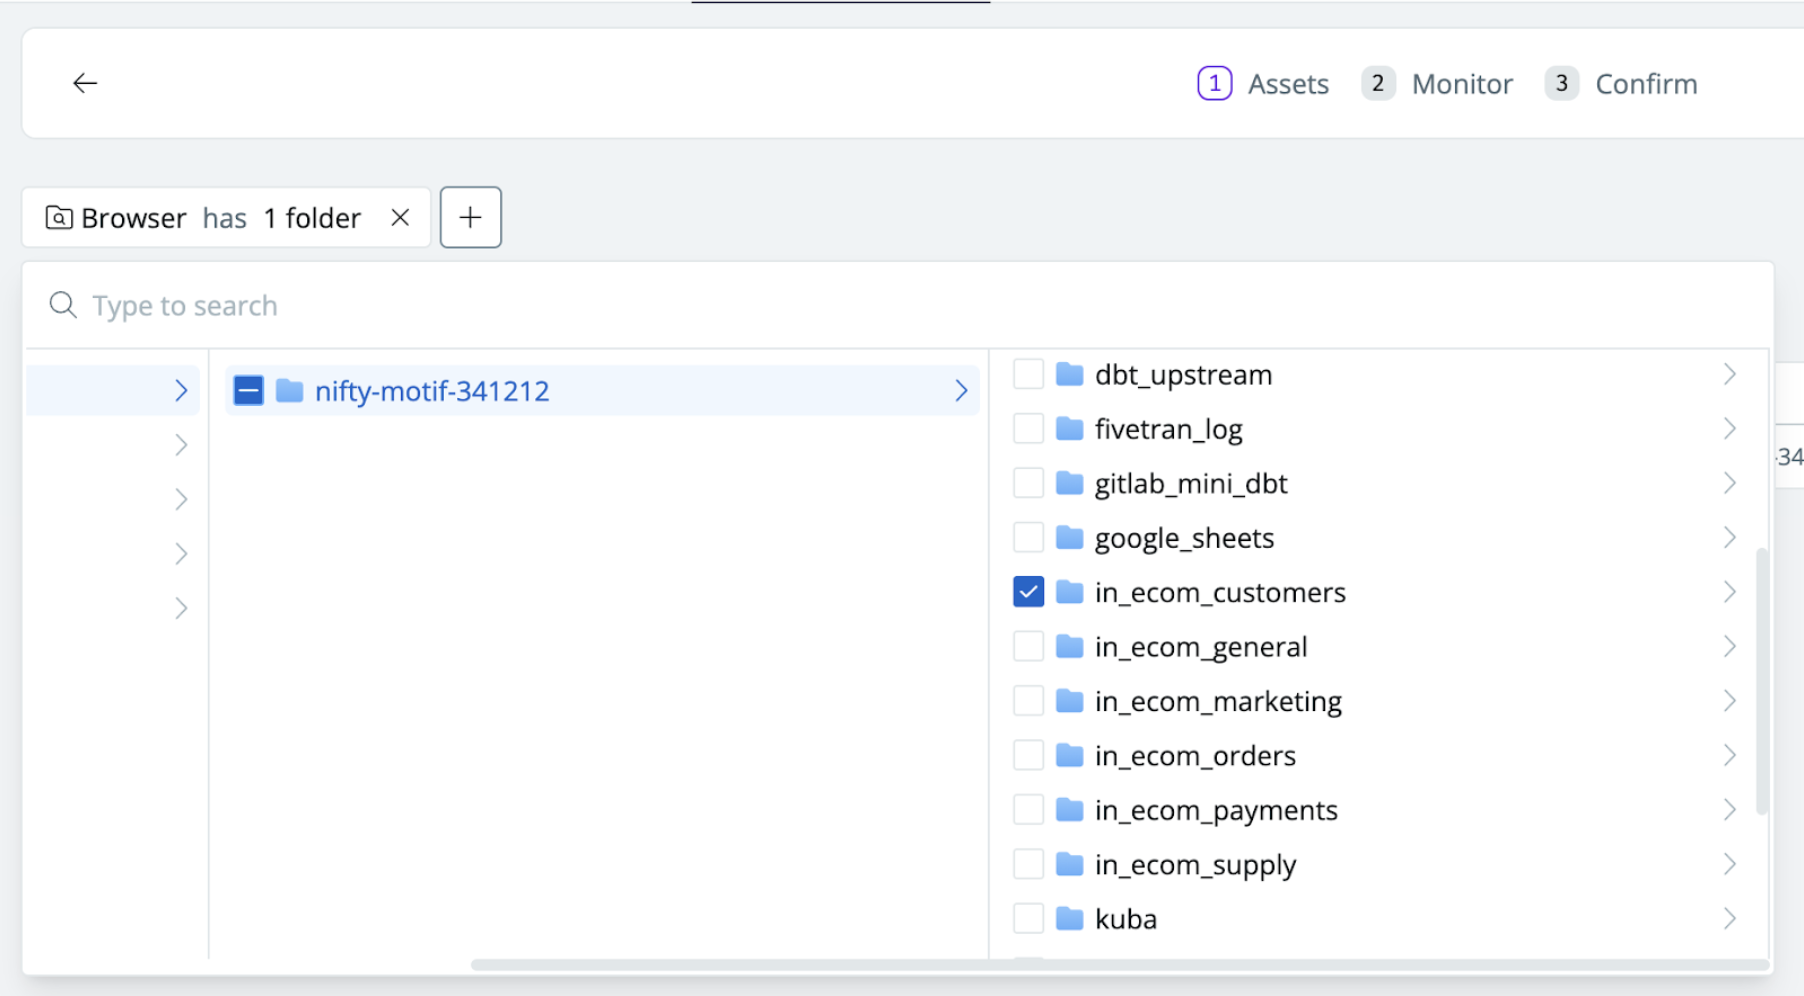
For a more targeted monitoring strategy, we recommend strategically placing monitors upstream of important assets. For example, set up freshness monitors to automatically be added on all sources upstream of your core CLTV marketing data product.
Programmatically monitor all upstream sources of specific data products
While freshness checks can be good at detecting if no new data is arriving, we recommend supplementing them with volume monitors to detect issues where data still flows but at a reduced rate.
Encode business expectations via dbt tests
dbt provides a range of checks to proactively monitor your data for quality issues. You should be intentional about which tests you use to balance coverage with the signal-to-noise ratio.
Use generic tests for important tables
At the most basic level, you should start by adding relevant generic tests to your important data models. dbt has four generic tests (uniqueness, not_null, accepted_values, and relationships) that come out of the box and can be deployed with minimal configuration.
In most cases, we recommend at a minimum adding uniqueness and not_null tests for important models. Uniqueness is helpful in detecting that there are no duplicate values or recurring rows in a dataset. not_null should be used in cases where empty or null values are indicative of a data issue.
Prevent fanout by checking for common issues
Fanout happens when you join a table and you can no longer trust aggregate functions on either your primary table or your joined tables. This most commonly happens when you have a one-to-many relationship between the primary table and the joined table and end up double counting.
To address this you can apply tests such as
- Primary keys are unique and non-null
- Row counts are correct
- Duplicate rows are not introduced in joins
- Relationships between upstream and downstream dependencies line up with your expectations
For example, check that the number of rows on the combined table matches the number of rows on the primary table before you apply aggregation functions by using the expect_table_row_count_to_equal_other_table test from dbt-expectations.
Express business limitations as tests
Where known business limitations are identified, additional rules should be used to account for this. For example, the calculated expected conversion rate for the CLTV model should always be between 0% and 10%. dbt expectations provide a range of pre-defined tests that can help capture more advanced edge cases such as expect_column_values_to_be_between, expect_column_values_to_be_increasing, and expect_select_column_values_to_be_unique_within_record.
Use dbt tests to reconcile data sources
dbt tests are great as a reconciliation tool to ensure that data across systems is comparable when doing so manually is no longer feasible.
For the CLTV data product, when a customer has been created in Hubspot (used for email marketing) a similar entry must also exist in SalesForce (used for CRM) so the sales team can follow up 1:1 with high-potential customers.
Considerations when using dbt tests
Once you start testing and see the impact, it’s not uncommon to see the number of tests start to grow rapidly. We recommend taking the following steps into consideration
- Test upstream and early – data is almost always connected through lineage relationships, and when an incident occurs in your most important tables, the damage might already be done. Preferably, you catch issues upstream by testing early to prevent downstream impact on end-users.
- Remove unnecessary tests – it is important to maintain the right balance so failing tests are evaluated and actioned by the data team. If a test has been failing for weeks and you haven’t addressed it, it’s probably not important, and you can delete it
- Use severity intentionally – in dbt you can use severity error or warn. dbt can be configured to stop downstream dependencies from running in the case of an error-level failure. Use warn and error severities intentionally and set expectations that error-level test failures should be addressed timely
- Monitor known issues – some tests may fail due to known issues in the backend as you’re awaiting an engineer to implement a fix. It can be helpful to still run these tests but less frequently. See step 7 in our eBook The complete guide to building reliable data with dbt tests for more details
- Beware of costs – you should pay attention to the cost of your tests. It’s not uncommon for test runs to take up a meaningful amount of cost, especially if they’re run frequently
Example of a duplicate user_id error being prevented from propagating downstream
Deploy volume monitors to detect abnormal table shrink or growth
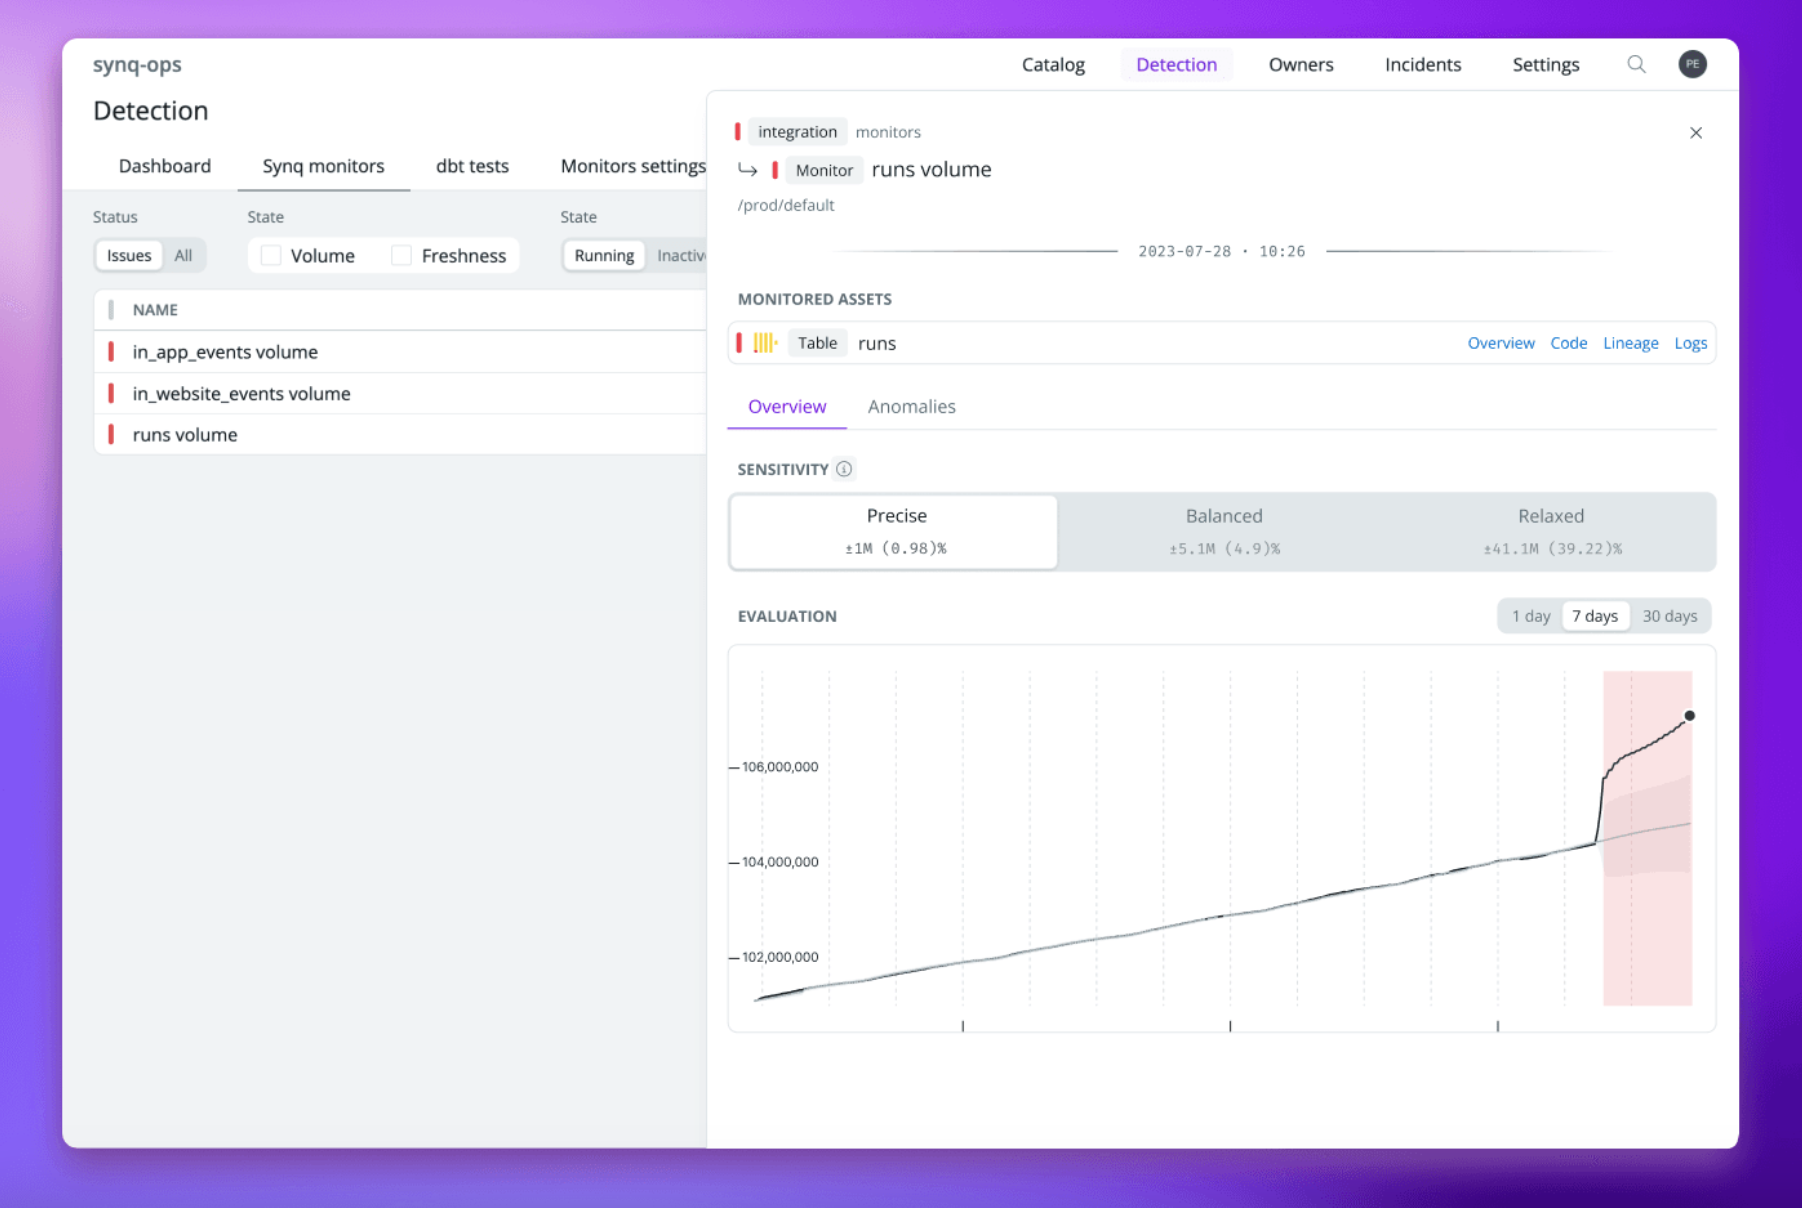
Volume monitors check the row count for a table and can help you proactively detect sudden jumps or drops in data. The monitors are self-learning and automatically pick up on trends and seasonality to improve the signal-to-noise ratio
- Trend – e.g. the transaction volume is growing rapidly in line with the company’s recent fundraising and you’ll have to account for an expanding baseline
- Seasonality – e.g. on a few occasions such as end-of-month payday and Black Friday there are large spikes which are expected and shouldn’t be treated as issues
While you can provide feedback to anomalies that are detected by your observability tool and let the model know that a flagged anomaly was in fact expected, volume monitors, are not suitable for all tables.
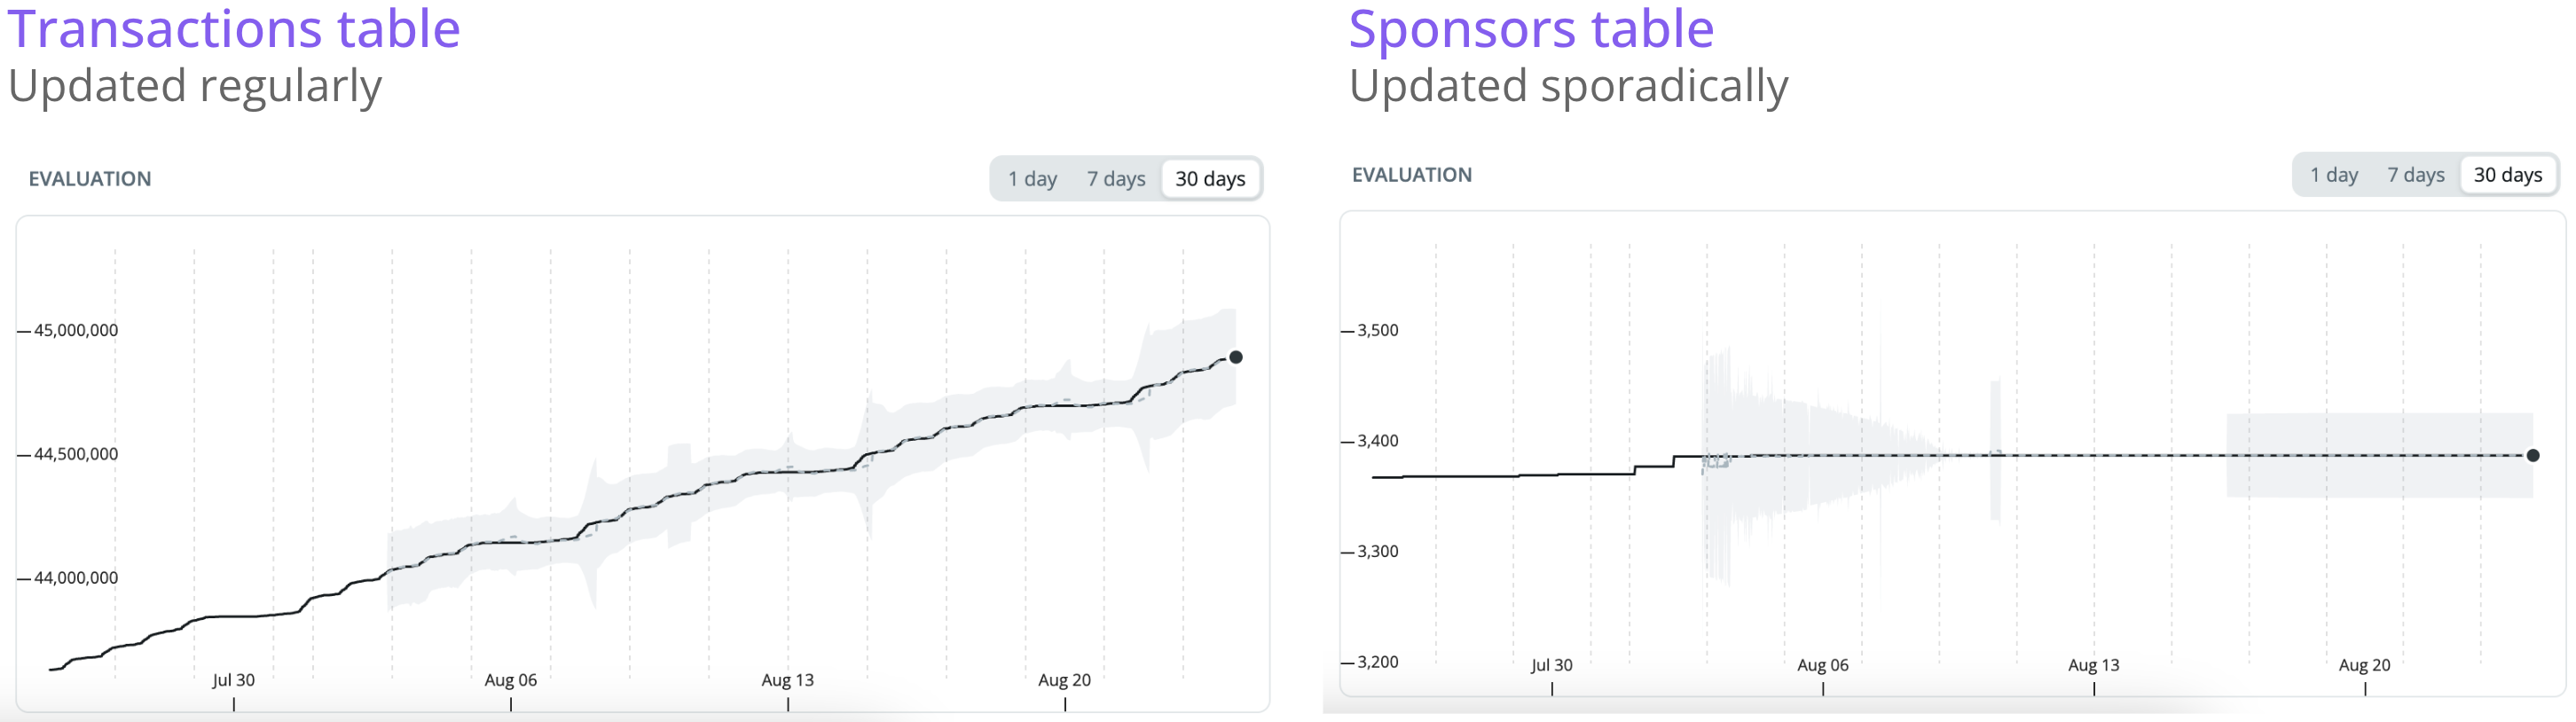
In the example above, the Transactions table gets new rows all the time as users make transactions. A sudden spike or drop in the number of transactions is in many cases unexpected and should rightfully be flagged as an anomaly for the data team to assess.
On the other hand, the Sponsors table only gets new data sporadically on the rare occasion that the company acquires new sponsorships. Sometimes there are weeks between new sponsorships being signed. For this type of data, it’s much harder for a model to learn what the expected behavior is, and in most cases, you should avoid placing volume monitors on these.
An example of a volume monitor being triggered in Synq due to a spike in the number of rows that exceeds the expected range
Use anomaly distribution monitors at the edge
Even when you have a well-tested data pipeline with freshness checks, data quality tests, and volume monitoring, you may still be blind to more nuanced issues. For example, it’s easy to overlook a sudden shift in the row count of one segment, or the conversion rate metric for Meta ads declining 4ppts easily goes missing. We recommend you test your final data models before they’re exposed to 3rd party tools or used downstream with distribution monitors.
Distribution monitors check if specific partitions or segments behave unexpectedly. For example, if the row count for one marketing channel suddenly drops unexpectedly or the conversion rate for Meta ads doubles, you’ll know about it.
Monitor row count for different advertising channels
In our example above, the CLTV model relies on data from Meta, Google, and a handful of other ad providers. It’s not unthinkable that a data ingestion error in Fivetran or an issue in the API for one of the 3rd party systems such as Meta can cause this data to have anomalous behavior and suddenly spike by 30%. Distribution monitors automatically learn the volume patterns of the different marketing channels and detect if the row count in a segment is behaving unexpectedly.
Detect unexpected changes in key metrics
One of the core data points that the marketing team relies on is customers’ likelihood to convert. While the conversion rate may vary over time, a jump from 1% to 5% for one channel is unexpected. With distribution monitors on the conversion rate metric, you’ll proactively know if there’s a sudden spike in the conversion rate for one of your channels so you can investigate the root cause and prevent downstream impact.
One of the benefits of distribution monitors is that they can be configured to automatically adapt to new segments. So when you add new marketing providers or expand to new geographical regions the monitors automatically pick these up and warn you of abnormal behavior.
Use ownership & importance to better monitor at scale
It’s not uncommon for data teams in scaling companies to have thousands of data models and tables (20% of dbt projects have more than 1,000 dbt models). To supplement your monitoring strategy and avoid ending up with alert fatigue from a never-ending stream of alerts we recommend that you’re explicit about what data is important and who the owner is.
This can help you create clear boundaries, set expectations, and make sure the right people are held accountable. We’ve written guides to help you get started with these
- How to identify your business-critical data - practical steps to identifying business-critical data models and dashboards and drive confidence in your data
- Defining ownership and making it actionable - what to consider before defining ownership, how to manage ownership of upstream and downstream teams, and a few simple steps to getting started
- Designing severity levels for data issues - things to consider when setting severity levels, how to act based on different severity levels, and simple steps to getting started
Summary
To build reliable business-critical data products and proactively catch data issues, we recommend you implement a monitoring strategy that blends dbt tests with anomaly monitors.
- Monitor freshness for data flowing to the warehouse – Use dbt source freshness tests for sources where you have explicit business SLAs and expectations. Apply automated freshness monitors if you don’t know what the exact threshold should be or if you’re unaware of or failed to anticipate a freshness check was needed
- Encode business expectations via tests to make sure they’re met – In addition to generic not_null and unique tests, dbt should be used to express expectations of your data such as expected ranges, and to reconcile data across source systems to ensure consistency
- Deploy volume monitors to detect abnormal table shrink or growth – Volume monitors automatically learn the seasonal and trend patterns of your data to alert you of sudden changes
- Deploy distribution anomaly monitors at the edge – Distribution monitors help check if specific partitions or segments behave unexpectedly. For example, if the row count for one marketing channel suddenly drops unexpectedly or the conversion rate for Meta ads doubles, you’ll know about it

.png)
.png)